
Elements Pulse helps IT leaders — CIOs, CTOs, and Heads of IT — answer the question that matters most: What friction is getting in the way of employee productivity, and what should we fix first?
Despite significant investments in tools, employees still face daily friction that hinders productivity and collaboration. IT leaders struggle to justify decisions without clear data, and existing dashboards fail to provide a shared narrative for leadership.
Elements Pulse is not a reporting tool, it's a decision instrument.
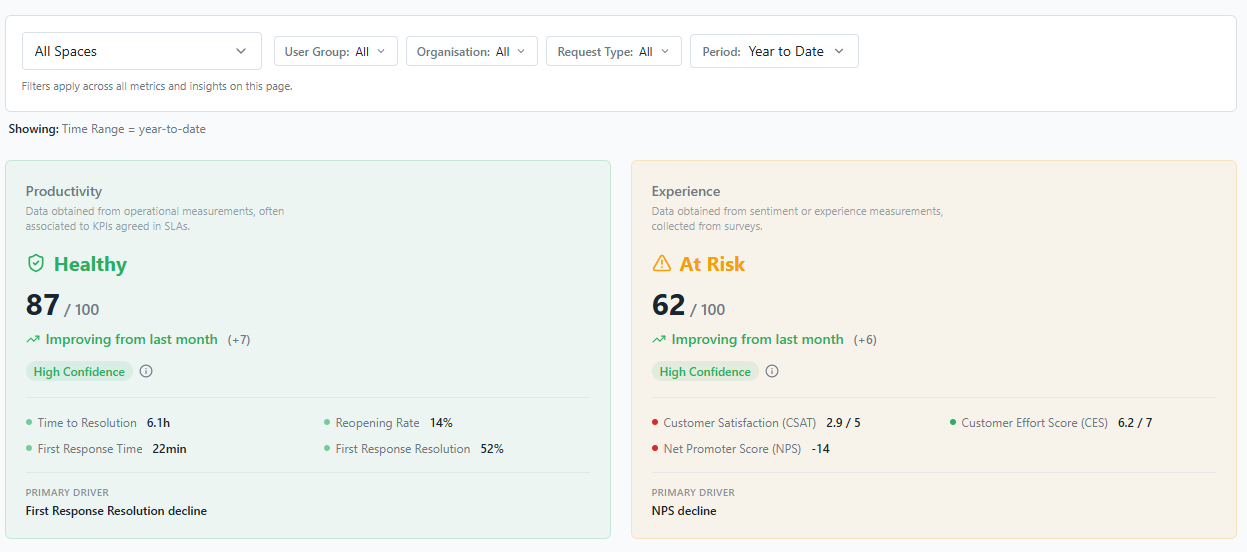
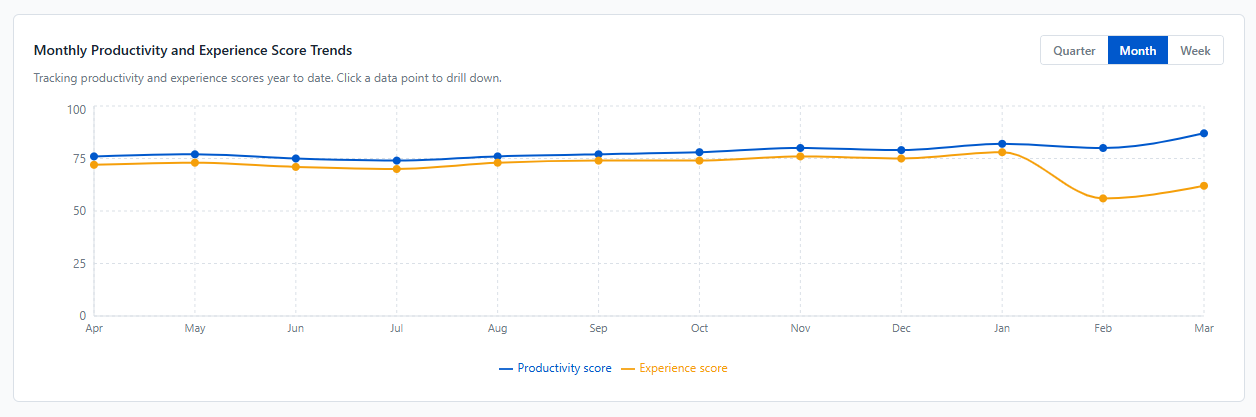
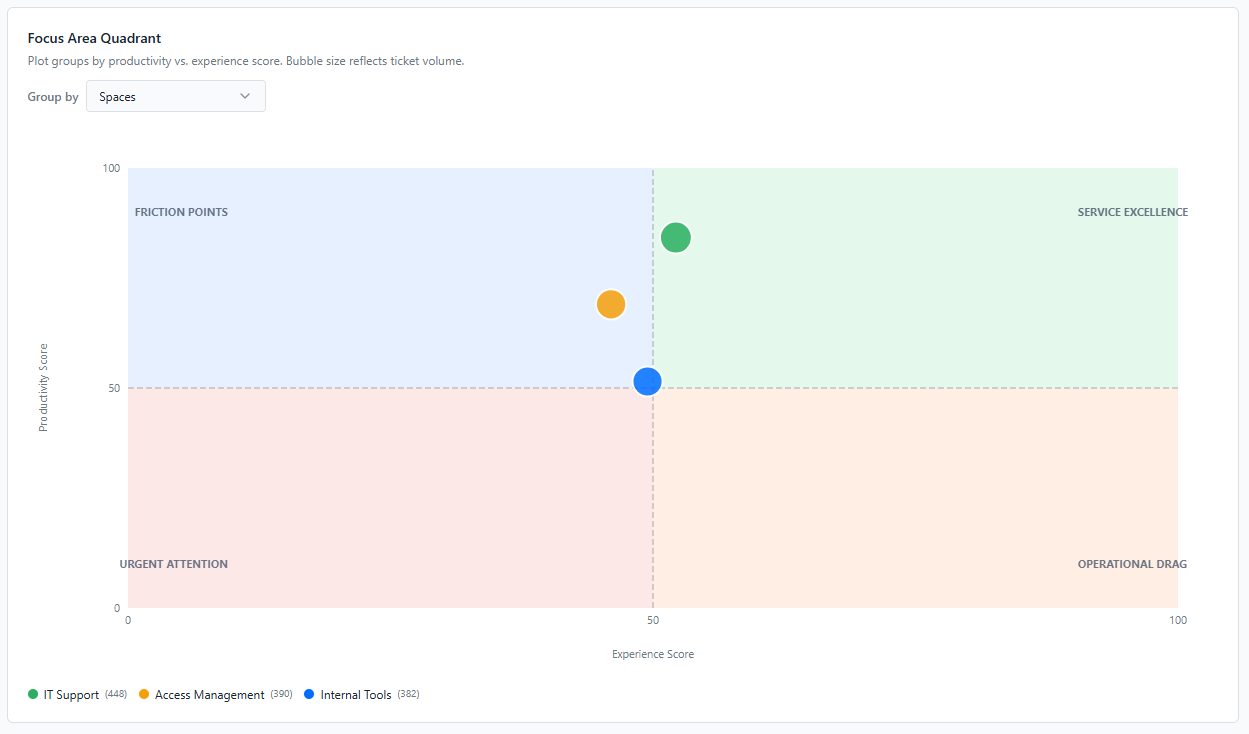
By combining operational data (O data) — Jira/JSM metrics like TTR, first contact resolution, and reopening rates — with experience data (X data) — CSAT, NPS, CES, and custom surveys — Pulse turns complex service metrics into clear, leadership-ready insights that help you decide where to invest, what to fix first, and what impact to expect.
What Pulse enables:
-
Collect O & X data — operational metrics from Jira/JSM alongside experience signals from customizable surveys with conditional logic, multiple formats, and easy targeting
-
Interpret — dashboards that let you drill down from high-level scores to individual tickets and agent activity, with trend comparisons over time
-
Share — custom dashboards and Confluence exports that help IT teams communicate impact, enable other departments, and justify their activity to leadership
Key differentiators:
-
Business-oriented reports that translate complex O/X data into leadership-ready insights
-
An improved, easy-to-use integrated surveying tool
-
Focused on X and O data — not device/network telemetry — to improve the internal employee experience