Help teams efficiently track their OKRs in Confluence
Problem: Teams can struggle with keeping track of their OKRs
OKRs are a popular management strategy to define and track Objectives and Key Results. It helps create alignment and engagement around measurable goals. Studies show that team members are more engaged in their work and more productive when they have a clear idea of what the team is trying to achieve and, more importantly, the significance of the task.
Confluence is Atlassian’s collaboration wiki tool, it’s great to help teams to collaborate and share knowledge and information efficiently. What better place than Confluence to track your company’s OKRs and share them across teams?
Confluence supplies great templates to help teams track their OKRs in the form of tables, however, they are quite wordy which makes it hard for teams to clearly spot where they stand and how far they are from achieving their targets.
Solution: Track your OKRs in a compelling tracker embedded in a Confluence page
With Elements Spreadsheet, you can track your company’s global OKRs and each of your teams' OKRs inside a compelling Spreadsheet document in Confluence!
Give your teams visibility over the current progress by consolidating OKRs in a global dashboard and maintaining motivation and engagement with powerful visual indicators.
![]()
Key Benefits
In this document, you’ll learn how to build an effective OKR tracker with Elements Spreadsheet for Confluence. This tutorial essentially focuses on the benefits of tracking OKRs in a simple yet effective tracker.
Download the following template to implement it quickly. You just have to import it when creating your Elements Spreadsheet macro.

Benefit 1: Summarize teams' OKRs in an executive summary dashboard
When OKRs are tracked throughout the entire company, it can be quite tedious and challenging for team leaders and executives to efficiently keep up with team members' progress and make sure they are moving in the right direction.
Team leaders and executives do not need a granular view of each team’s key results and objectives, they simply need to have a high-level view of where each team stands with regard to the OKRs they committed to.
Elements Spreadsheet allows you to summarize teams' OKRs in a simple “executive summary” dashboard tab:
![]() Reference each and every team’s objectives and progress in percentage contained in team-specific tabs
Reference each and every team’s objectives and progress in percentage contained in team-specific tabs
![]() Display each team’s overall progress
Display each team’s overall progress
![]() Display how many days remain until the next cycle
Display how many days remain until the next cycle
Benefit 2: Focus teams' efforts by setting up priority levels for each key result
You may help teams focus their energy on top-priority goals by assigning relevant priority levels to them and their underlying key results. This can be easily achieved by adding data validation to a Priority column as shown below:
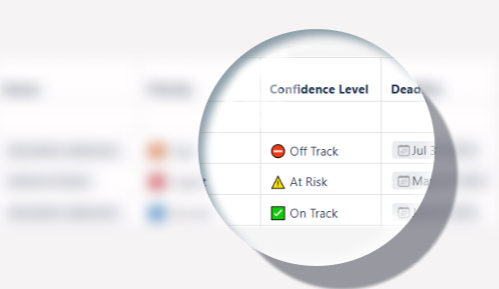
Benefit 3: Keep teams' key results on track by automating confidence level calculation
Unlike objectives which are qualitative, key results are quantitative and measurable. Once you know what you’re measuring, it’s important to know how you’re going to measure it.
With this spreadsheet document, each team can monitor progress and keep track of how close they are to achieving their objectives, typically in percentages, numbers or items set for each underlying key target.
Based on the key result metric entered, confidence levels can be automatically calculated using an IF function where teams can define the different conditions and the resulting outputs when such conditions are met.
In this spreadsheet document, the following conditions and results were defined:
If the measured key result is smaller than 35%, then the confidence level is
 Off Track
If the measured key result equals or is smaller than 47%, then the confidence level is
 At Risk
If the measured key result equals or is greater than 50%, then the confidence level is
 On Track
This translates into the following formula:
![]()
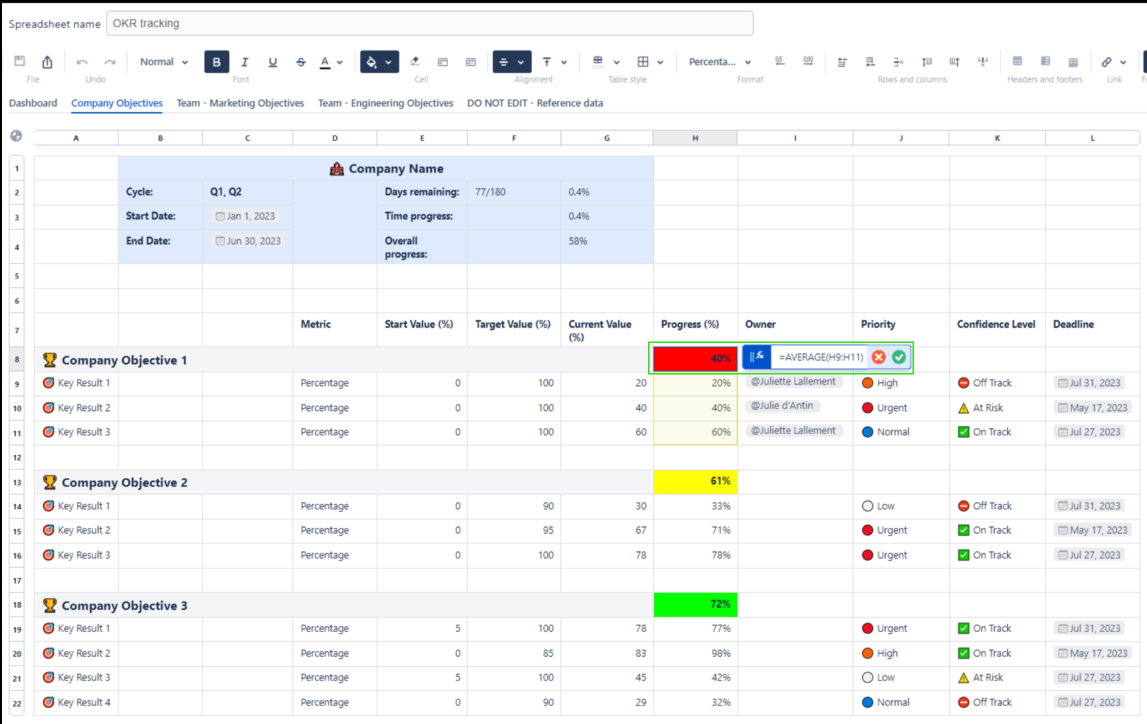
Benefit 4: Calculate objective progress from averaging out key results
Each (qualitative) objective is broken down into underlying (quantitative) key results. As seen above, key results are measured against a defined metric. Based on these key results, it’s possible to calculate the progress of their overarching objective by averaging them out.
Calculating this average is a child’s play using the =AVERAGE(range) function: