How to generate Confluence charts from a Spreadsheet macro
Atlassian recently released the Table Extensibility feature in Confluence Cloud which allows for the visualization and manipulation of data in table format from multiple data sources.
Table Extensibility allows elements, such as a data macro, to act as the source of another element.
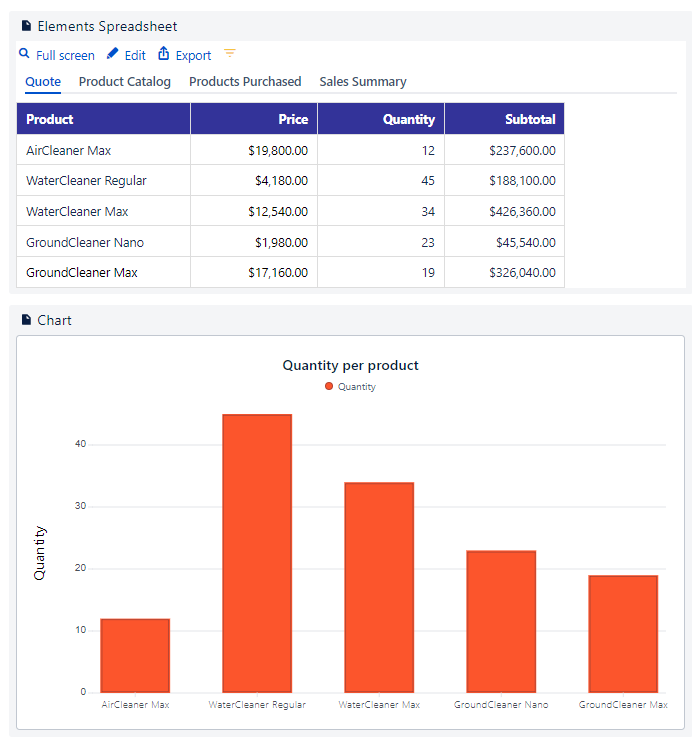
Elements Spreadsheet can now be used as the data source for native Confluence charts. Let’s see how to do this.
(Optional) Configure what sheet of the Spreadsheet macro to use as data source
Currently, Table Extensibility capabilities only allow for a single sheet to be used as data source for native Confluence charts. However, if you would like to generate a chart for each of the sheets of your Spreadsheet document, you can follow the workaround described at the end of this page.
If no sheet is configured as data source, the first sheet of your Spreadsheet macro will be used as the source for the Chart macro by default.
In order to choose which sheet of your Spreadsheet macro should be used as data source for generating a chart, follow these steps:
Edit the Confluence page where the Spreadsheet macro is located
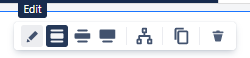
Click the Edit icon on the Spreadsheet macro

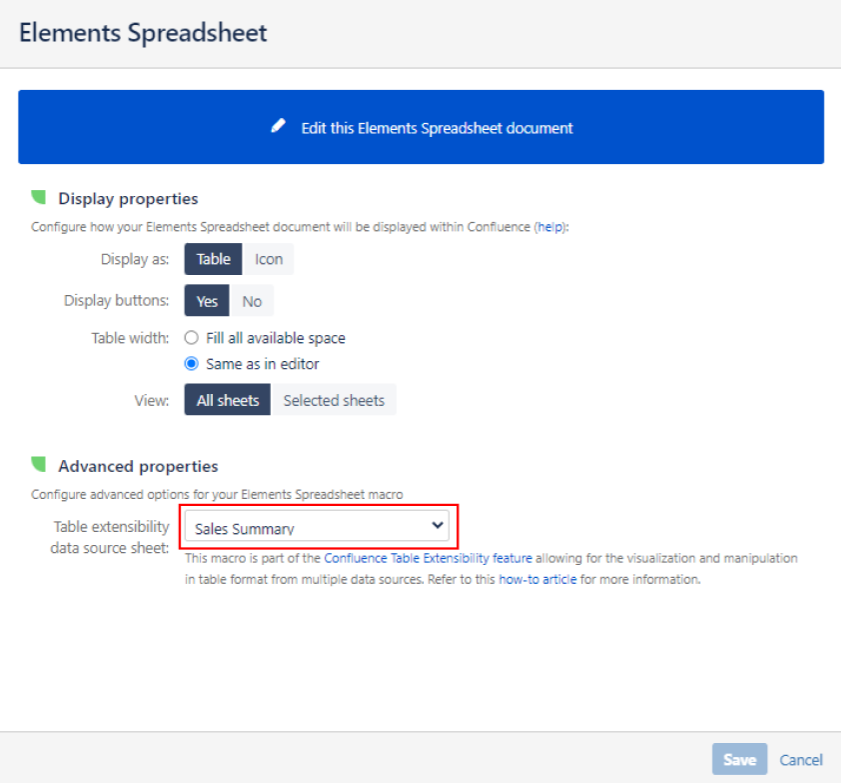
Select the relevant sheet from the Advanced properties

Save the Spreadsheet macro
Configure the target (Chart macro)
Now that you configured the data source of the Spreadsheet macro to be used, you can proceed with generating a chart.
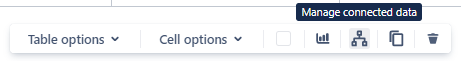
From the Confluence page edit mode, click the “Manage connected data' option from the Spreadsheet macro.
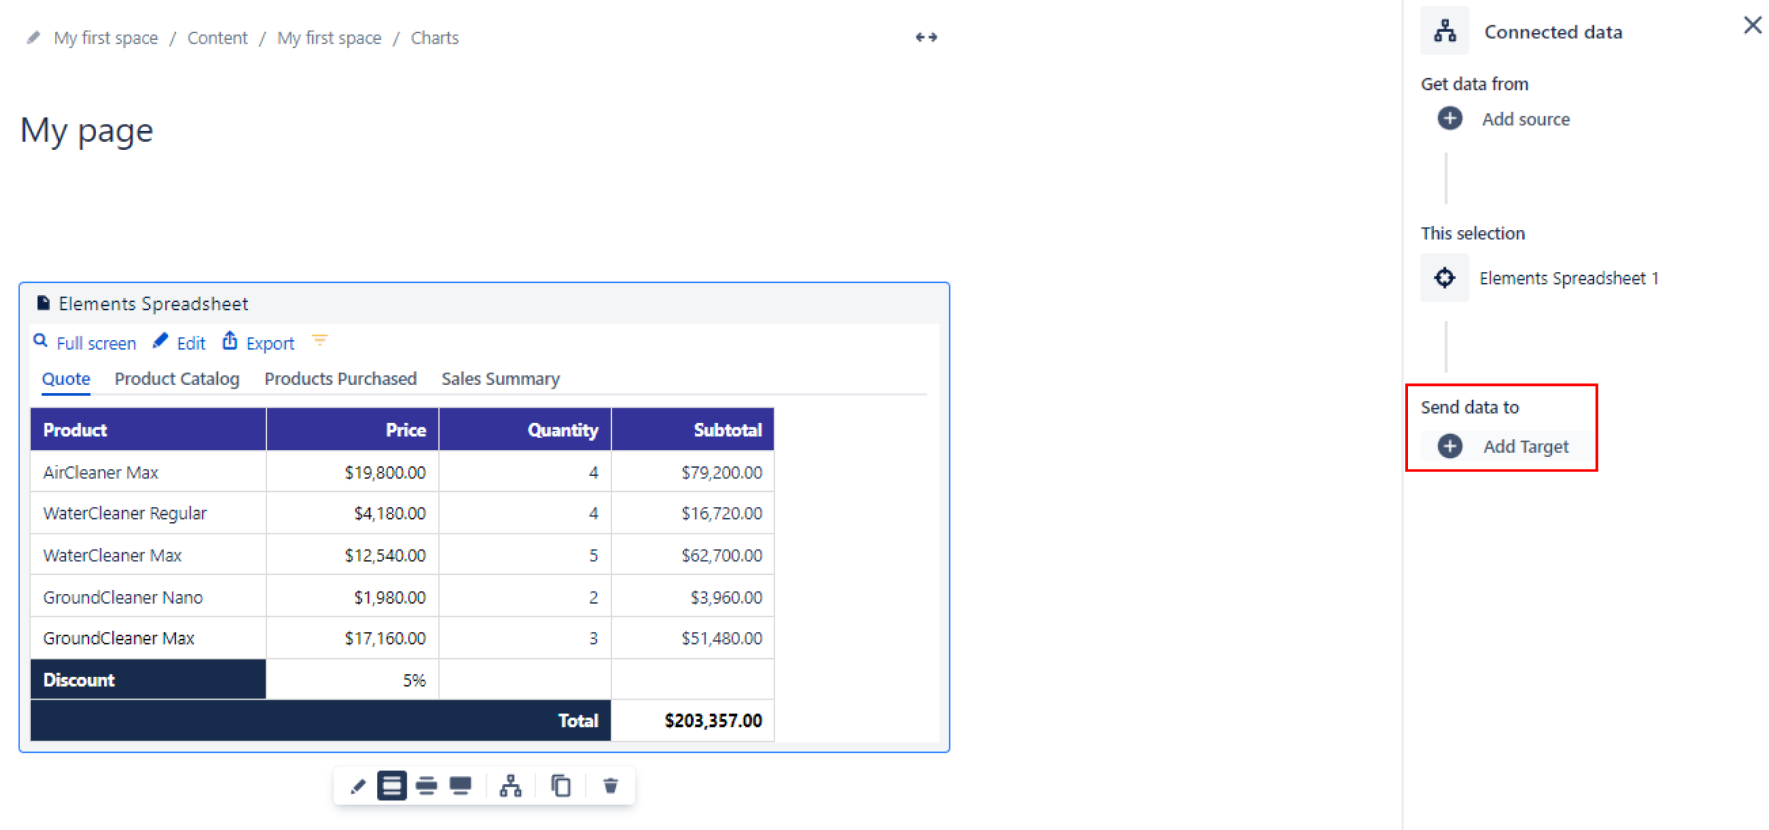
The Connected data panel will open up on the right side of your screen.
Under the “Send data to” section, click “Add Target”
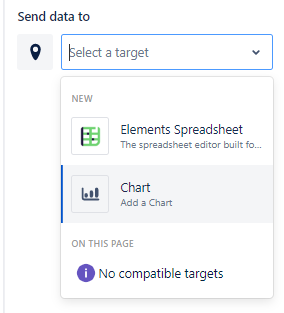
Then select “Chart” as target
The chart macro will be inserted underneath the Spreadsheet macro.
Configure chart options
You can now tweak how you would like the chart to look like and how data should be displayed.
Simply click the “Chart options” from the chart macro

Choose the relevant chart type
Choose what column to display on the X axis
Filter what columns to use in the data series
Note: The chart macro also allows for style customization, including the definition of a title and axis labels as well as legend options.
(Workaround) Generate charts from different sheets from the same Spreadsheet macro
In the event where you use a Spreadsheet with multiple sheets and would like to generate a chart for each of them, you can follow this workaround:
We assume here that you already generated a chart from the first sheet of a Spreadsheet macro by following the aforementioned steps.
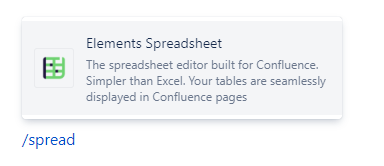
If you need to generate a chart from a second sheet of the same Spreadsheet macro, call the Spreadsheet macro by typing /spread and select Elements Spreadsheet from the macro dropdown
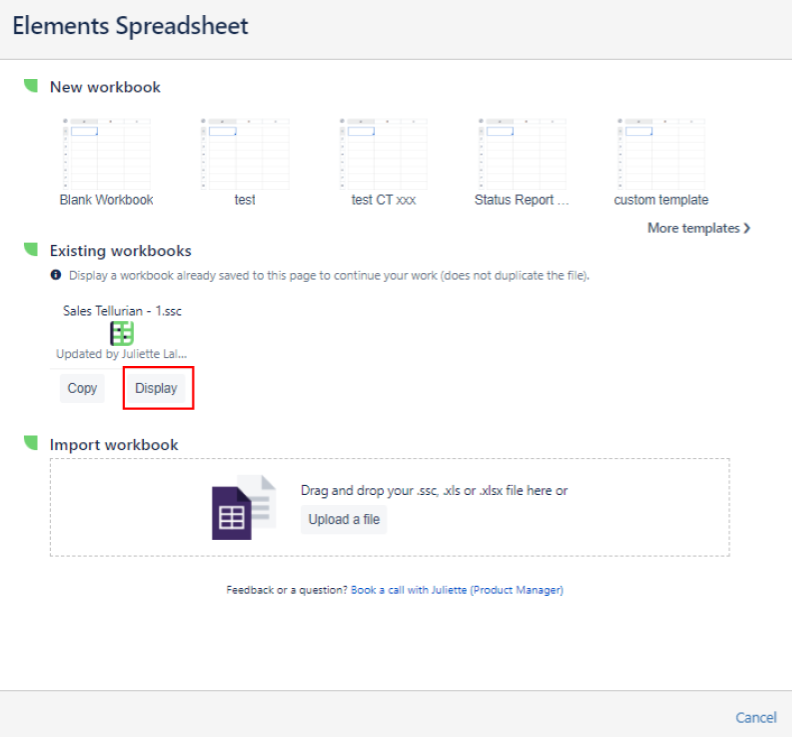
From the “Existing workbooks” section, click the “Display” option from the relevant macro
Provide the Spreadsheet macro with a name and save it
Click the Edit icon on the Spreadsheet macro
Select the relevant sheet from the Advanced properties
Save the Spreadsheet macro
Follow the same steps described above to configure the target and chart options.
That’s it!
Limitations
Empty cells and strings
The Confluence chart macro has some limitations when it comes to displaying data. For example, it will fail to display or will poorly display empty cells or cells containing strings in a data series.
You can work around this by simply filtering empty values inside your Spreadsheet macro or hiding appropriate rows and columns.
PDF/Word export
Chart macros do not currently get exported to PDF and Word.