
Atlassian recently released the Table Extensibility feature in Confluence Cloud which allows for the visualization and manipulation of data in table format from multiple data sources.
Table Extensibility allows elements, such as a data macro, to act as the source of another element.
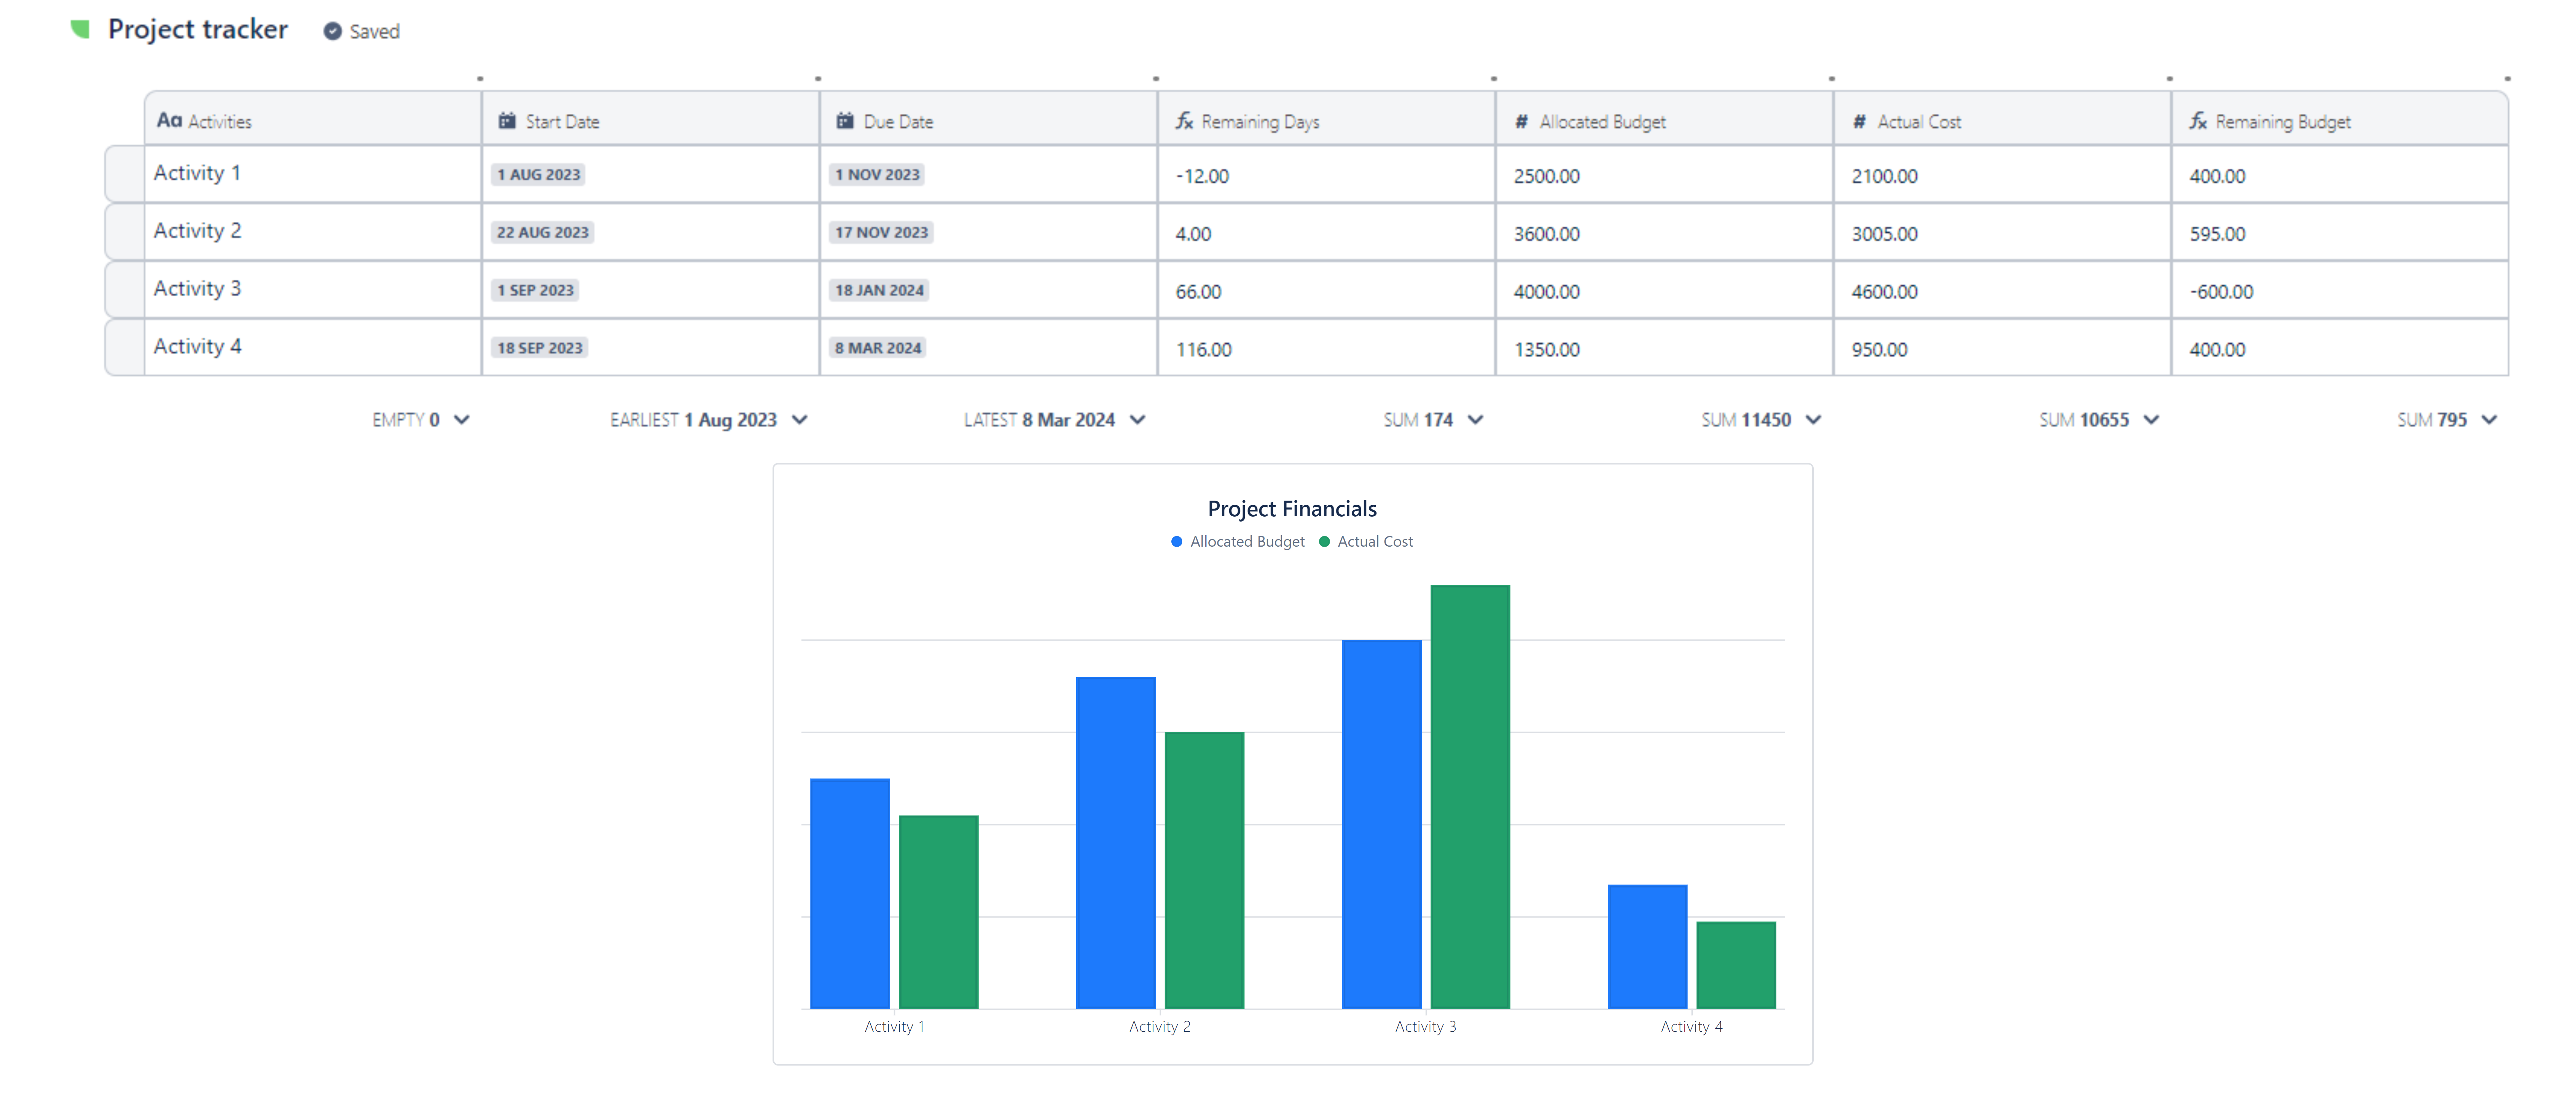
Elements Project Tables can now be used as the data source for native Confluence charts. Let’s see how to do this.
Configure Target (chart macro)
-
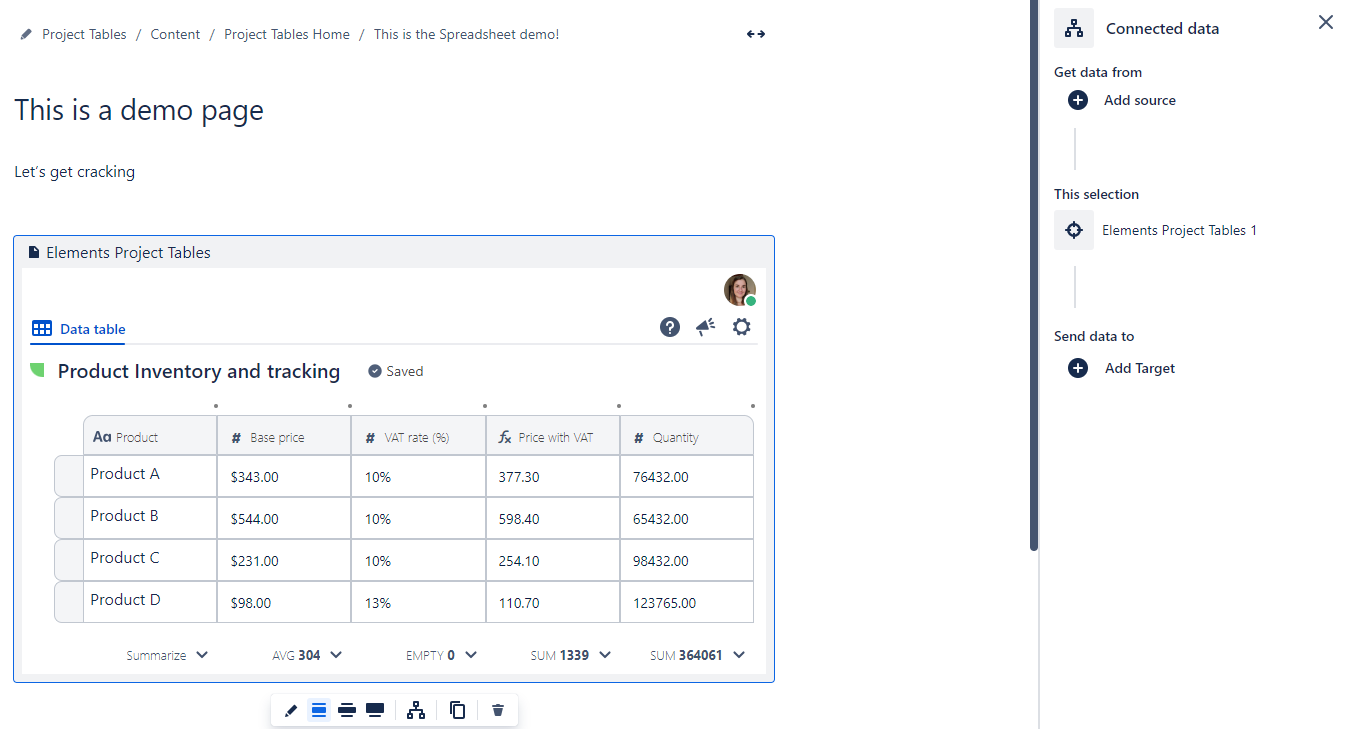
From the Confluence page edit mode, click the “Manage connected data' option from the Project Tables macro.
.png?cb=2b2db351e5d162aaee3434056e092060)
The Connected data panel will open up on the right side of your screen.
-
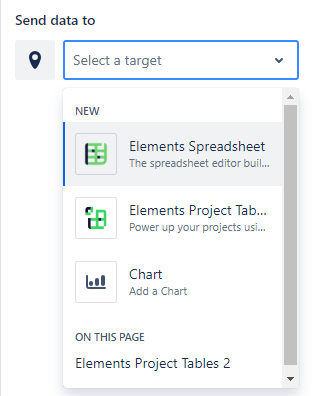
Under the “Send data to” section, click “Add Target”
-
Then select “Chart” as target
The chart macro will be inserted underneath the Project Tables macro.
Configure chart options
You can now tweak how you would like the chart to look like and how data should be displayed.
-
Simply click the “Chart options” from the chart macro
.png?cb=2e916ad6e8f6b5364db1a5b2fa499cf6)
-
Choose the relevant chart type
-
Choose what column to display on the X axis
-
Filter what columns to use in the data series
Note: The chart macro also allows for style customization, including the definition of a title and axis labels as well as legend options.