
The Project Tables editor was crafted with a user-centric approach, making it really easy to use while sporting a sleek and intuitive interface.
Whether you're a seasoned pro or a newcomer to project management, our design ensures that you can effortlessly create and manage tables with utmost simplicity, focusing on your tasks and projects without the burden of a cluttered interface.
The editor at a glance
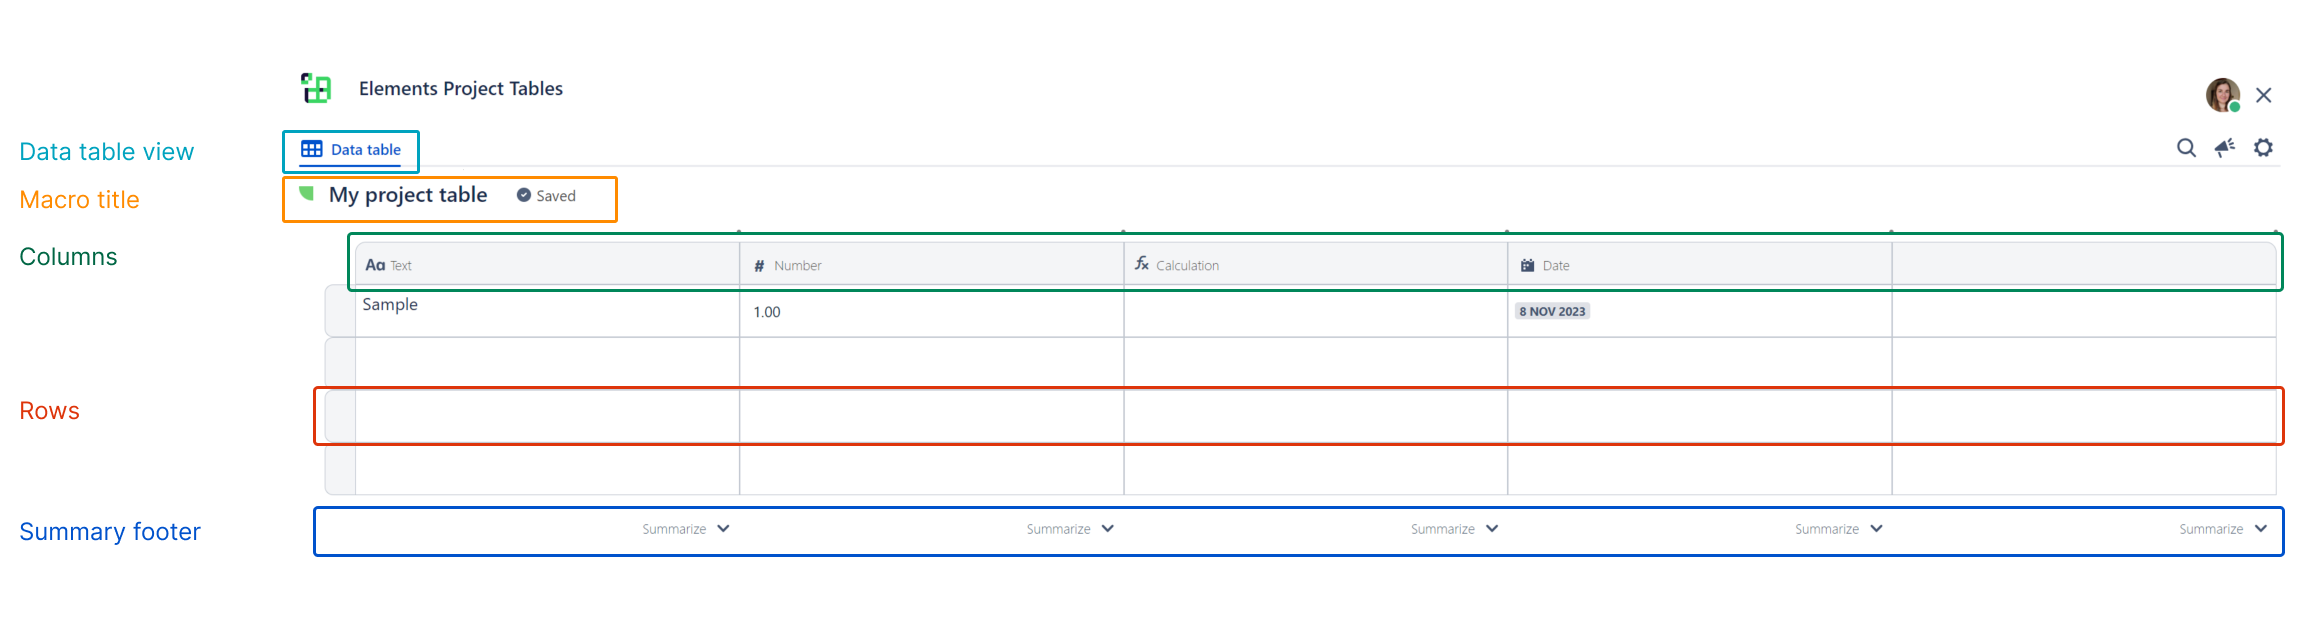
Data table view
The Data table view is the default view when creating a Project Tables macro.
By default, it consists of four columns and four rows but you can add as many rows and columns as you wish.
For now, the data table view is the only view available. The ability to add more views will be supported in the future. Note that views are specific to each individual Project Tables macro. they can be used to show only specific columns or rows, and have their own unique configurations to hide, sort, and filter rows from the Data table view.
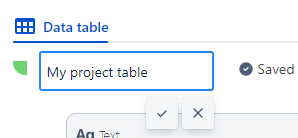
Macro title
The macro title is automatically defined for you when you create a Project Tables macro. You can edit it by simply clicking the title input.
Columns
Columns hold specific data based on their type and allow you to organize all that information so it can easily be sorted, managed, and analyzed.
Project Tables currently support the following column types:
Rows
A row is an individual item in your data table. If you're crafting a staff directory, it's each person. If you're tracking inventory, it's a product. If you're tracking a project, it's a task or deliverable.
You can think of a row as a record, identified by a unique identifier.
Summary footer
The summary footer allows you to summarize the data based on the column type.
Here are the following metrics that are available to you based on the column type:
|
Text column |
Number column |
Date column |
Calculation column |
Select list column |
People Column |
|---|---|---|---|---|---|
|
Count filled |
Count filled |
Count filled |
Count filled |
Count filled |
Count filled |
|
Count empty |
Count empty |
Count empty |
Count empty |
Count empty |
Count empty |
|
Count unique values |
Count unique values |
Count unique values |
Count unique values |
Count unique values |
Count unique values |
|
|
Sum |
Date range (days) |
|
Count of <select list option selected> |
|
|
|
Average |
Earliest date |
|
|
|
|
|
|
Latest date |
|
|
|
Note that the metrics available for the calculation column will match the data output. For example, if the output is a number, the Number-specific metrics will be available. If the output is a date, the Date-specific metrics will be available.