
Analytics are available for each request type in the service catalog, providing key insights into catalog performance and portal usability. By identifying outdated or complex request types, you can optimize the catalog for a smoother user experience. Data-driven insights help drive continuous improvement, manage costs, and align services better, ultimately improving customer satisfaction and saving resources.
When the app is launched in a JSM project, it generates analytics for each request type using data from the past year. The processing time may vary depending on the number of issues in your project.
For future visits, analytics update every Monday at 1:00 AM (based on your Jira instance’s time zone). For the most accurate insights, we recommend reviewing the metrics on Mondays.
The following metrics are calculated based on data from the current week:
-
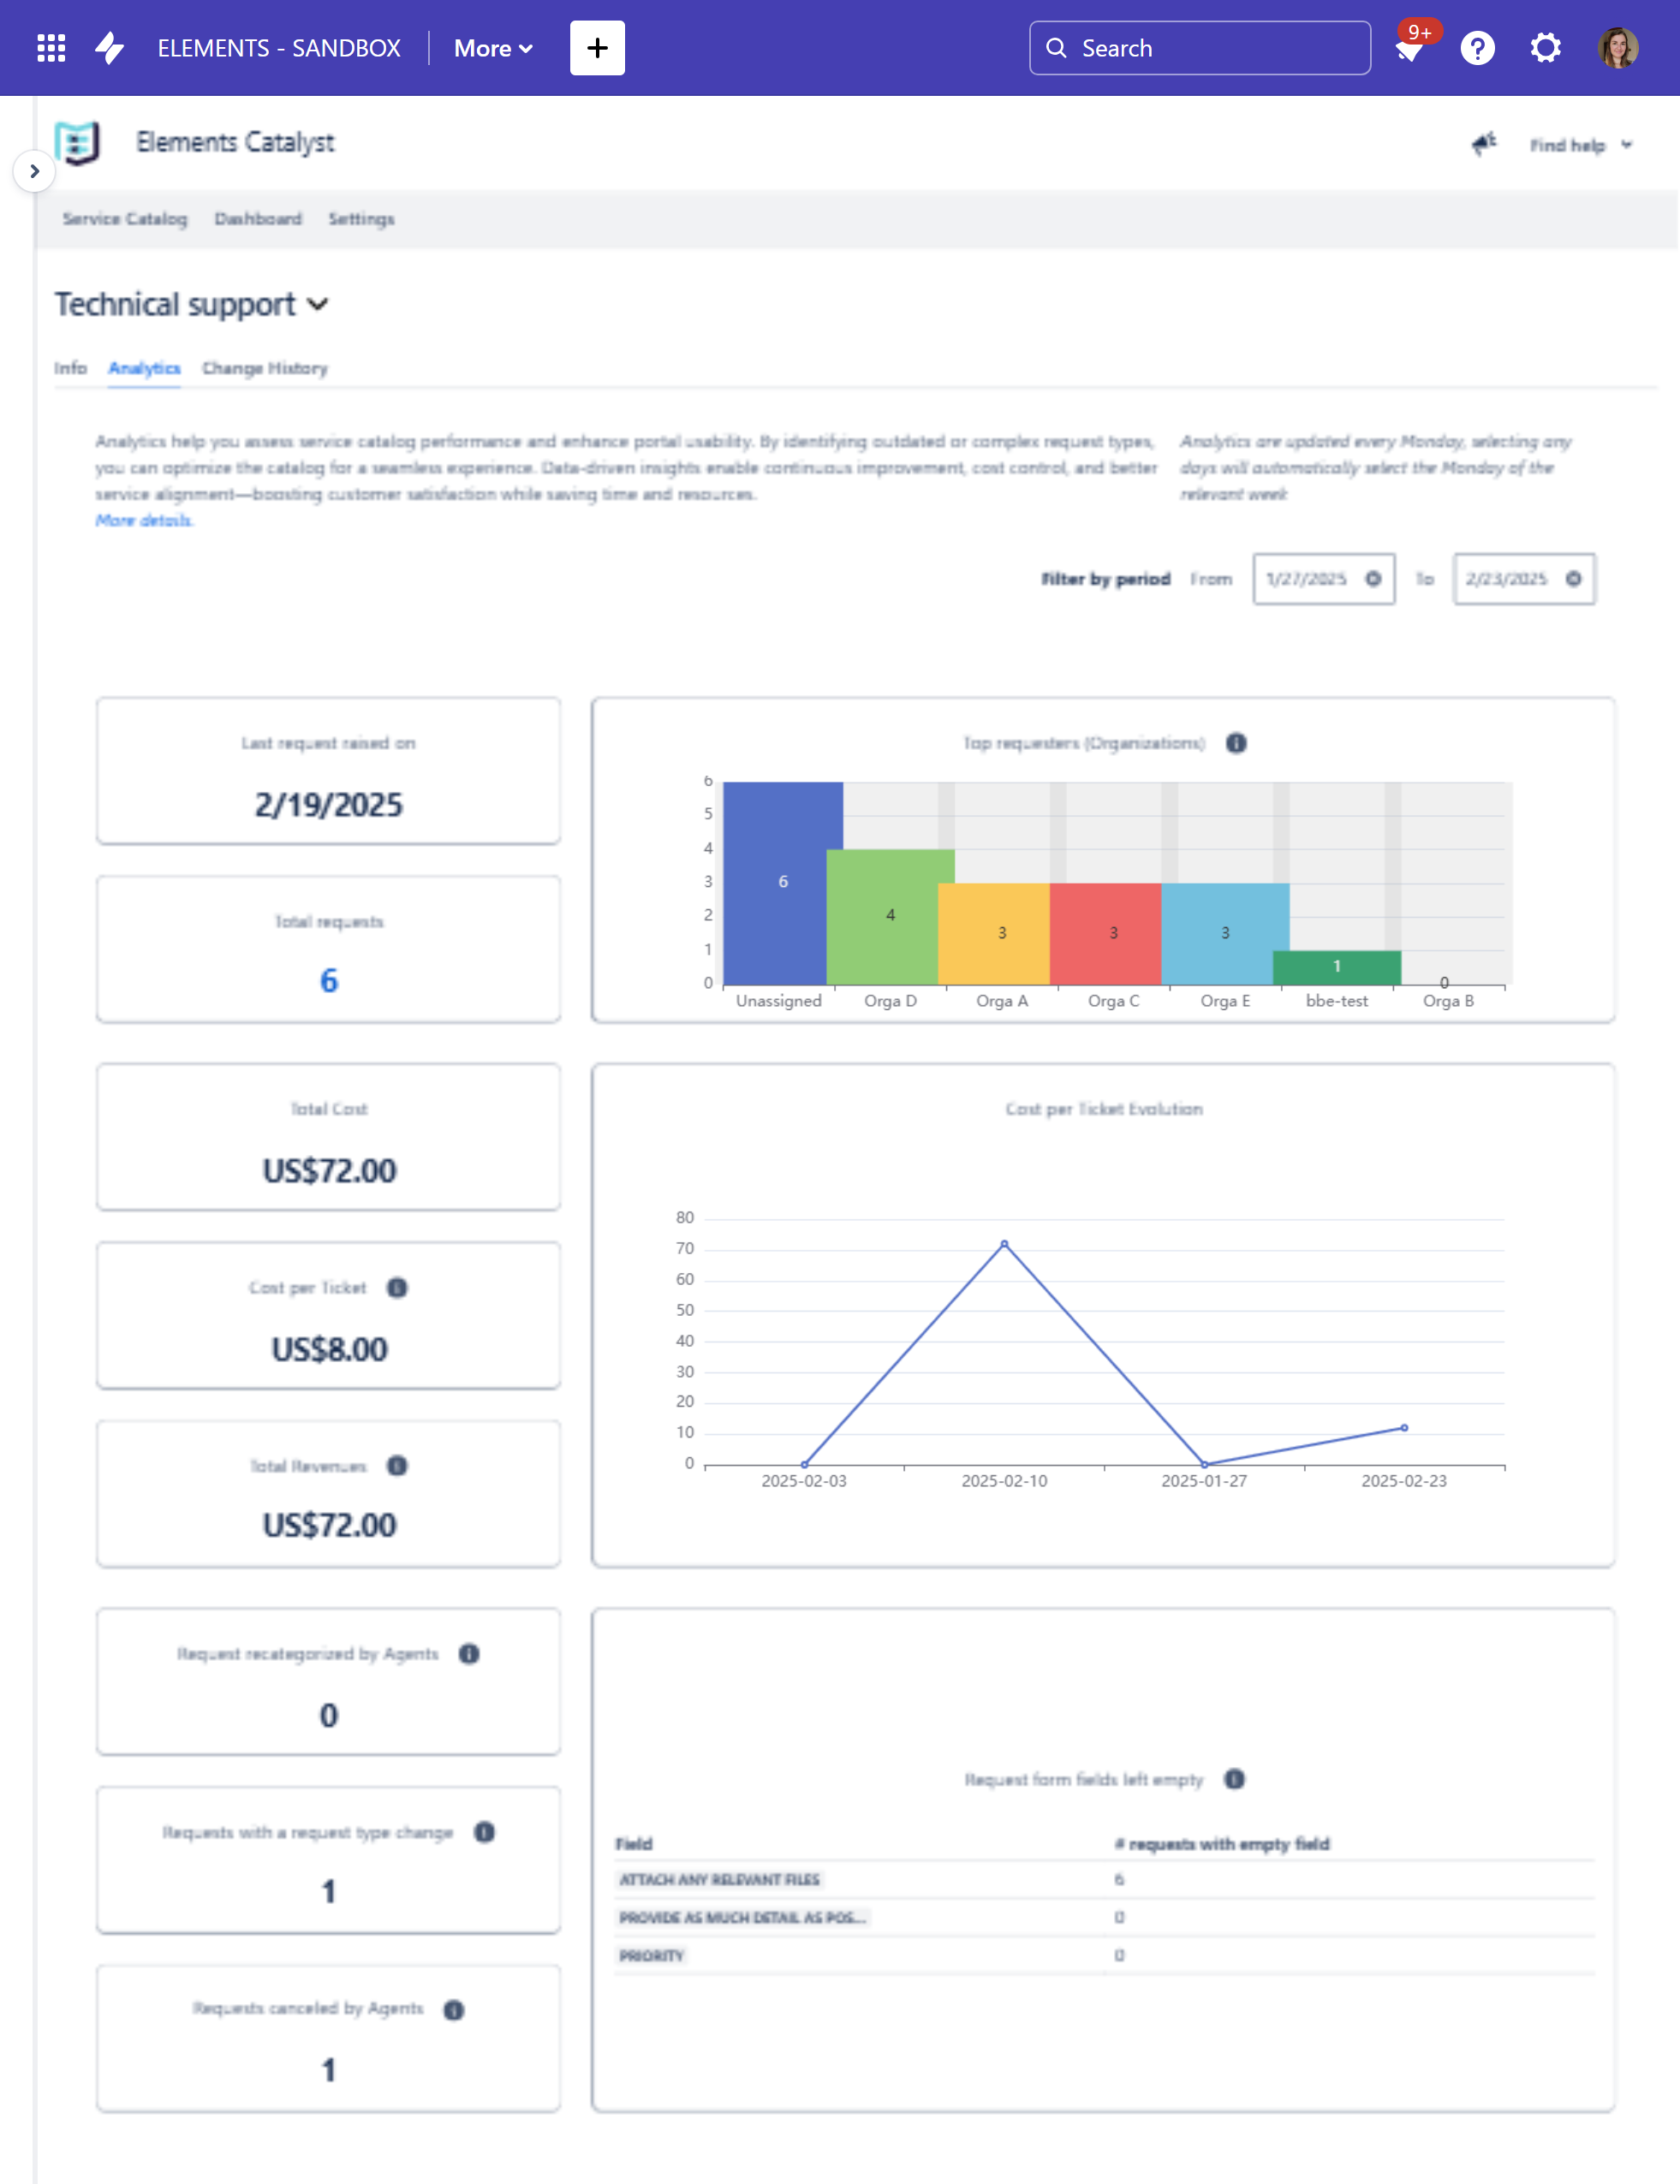
Last request raised on
-
Total Requests
-
Total Cost
-
Cost per Ticket
-
Cost per Ticket evolution
-
Total Revenues
By default, analytics data from the previous week up to the current day are displayed. You can filter for more historical data using the controls on the top right.
Selecting specific days will automatically adjust the data to the relevant Monday of that week.
Metrics Classification
The metrics are classified based on four key service catalog management categories to help service owners focus on what matters most:
-
Relevance – Measures if request types are still in use and meet user demand.
Includes Last Request Raised On, Total Requests and Top Requesters.
-
Usability – Measures how well request forms support users.
Includes Request Form Fields Left Empty, Requests with a Request Type Change, and Form Fields Left Unanswered.
-
Cost Effectiveness – Tracks service-related costs to ensure spending aligns with budget goals.
Includes Total Cost, Cost per Ticket, Cost per Ticket Evolution, and Total Revenues.
-
Efficiency – Evaluates how well the service request process is working, including agent and user efficiency.
Includes Requests Recategorized by Agents, Number of Forms Reopened by Service Desk, and Requests Cancelled by Agents.
Each metric helps optimize different aspects of your service catalog, allowing you to enhance overall efficiency, accuracy, and alignment with user needs.
Request usage
Last Request raised on
RELEVANCE
Based on live data, this metric isn’t impacted by Filters
This metric displays the date of the latest request which was created for the current request type.
This helps determine whether the request type is still relevant and actively used.
Total Requests
RELEVANCE
Calculated based on data from the current week
Shows the volume of requests submitted within the selected period, allowing service owners to track popularity and demand trends.
Top Requesters (Organizations)
RELEVANCE
Calculated based on data from the previous week
Highlights which customers (teams, departments, companies) submit the most requests. This helps with demand planning, resource allocation, and identifying high-usage groups.
How it’s calculated
-
The metric aggregates service requests over a defined period.
-
Requests are grouped by the organization of the requester.
-
Organizations are ranked based on the total number of requests submitted.
Only the top 10 Organizations are displayed by default. If this limit isn’t adequate for your use case, please let us know.
Financial Metrics
These metrics provide visibility into service-related costs, cost-effectiveness, and overall financial health of catalog items.
Total Cost
cost effectiveness
Calculated based on data from the current week
The Total Cost metric provides visibility into the overall expense of each request type within the catalog. It helps service owners and financial teams track IT spending, optimize budget allocation, and ensure cost efficiency.
Currently, service owners are responsible for manually defining the cost per service based on their own data sources. However, future enhancements in the product will assist service owners in determining appropriate service costs based on data insights, making cost estimation more accurate and data-driven.
How it’s calculated
-
The cost of each request type is manually entered by service owners based on external data (e.g., operational expenses, vendor pricing, or internal cost structures).
-
The calculation considers the cost per service multiplied by the number of times the service was requested over a defined period.
Cost per Ticket
cost effectiveness
Calculated based on data from the current week
The Cost per Ticket metric provides insights into the average expense associated with each service request over a defined period. It helps service owners evaluate the efficiency and cost-effectiveness of service delivery, supporting better financial planning and resource allocation.
How it’s calculated
-
The Total Cost of all service requests within a defined period is calculated.
-
This total is then divided by the total number of tickets (service requests) in the same period.
Cost per Ticket Evolution
cost effectiveness
Calculated based on data from the current week
This metric shows how the Cost per Ticket metric evolves over time.
Difference Between Total Cost and Cost per Ticket
Both Total Cost and Cost per Ticket are key financial metrics in service catalog management, but they serve different purposes and provide different insights.
1. Total Cost – Understanding Overall IT Service Expenses
✅ Helps IT and finance teams track the total spending on IT services.
✅ Identifies high-cost services, enabling cost-saving strategies.
✅ Supports budget planning and forecasting by showing how much is spent on service requests over time.
✅ Useful for chargeback/showback models to allocate costs to different departments.
2. Cost per Ticket – Evaluating Service Efficiency
✅ Provides a benchmark for service efficiency, helping teams optimize service delivery.
✅ Highlights cost trends per request, helping organizations identify whether service costs are reasonable.
✅ Helps compare costs across different services to prioritize process improvements and automation.
✅ Assists in identifying expensive services that may require cost optimization or alternative solutions.
In summary:
-
Total Cost is useful for understanding the big picture of IT service expenses.
-
Cost per Ticket helps assess the cost-effectiveness of handling individual requests.
Total Revenues
cost effectiveness
Calculated based on data from the current week
The Total Revenues metric provides visibility into the overall revenue generated from service requests.
It helps with:
✅ Revenue Tracking – Helps service owners and finance teams understand how much revenue is generated from IT services.
✅ Profitability Analysis – When combined with Total Cost, it helps assess whether a service is profitable or operating at a loss.
✅ Pricing Strategy Optimization – Enables service owners to fine-tune price per ticket based on service demand and costs.
✅ Budgeting & Forecasting – Supports financial planning by identifying trends in service revenue over time.
✅ Chargeback & Showback Support – Useful for organizations that internally bill departments based on IT service consumption.
By maintaining accurate price per ticket values and monitoring Total Revenues, organizations can optimize pricing, improve financial planning, and ensure sustainable service delivery.
How it’s calculated
-
The price per ticket is manually entered by service owners based on external factors such as market rates, internal pricing strategies, or cost-plus models.
-
The total revenue is calculated by multiplying the price per ticket by the number of times the service was requested over a defined period.
Fields – Usability Metrics
These metrics surface friction points in service request forms. They reveal how often form fields are left incomplete, guiding improvements in form design and user guidance.
Requests recategorized by Agents
efficiency
Calculated based on data from the previous week
This metric tracks the number of service requests where a service desk agent modified request form fields after submission.
It provides insights into the accuracy of initial request classifications and the efficiency of service categorization within the catalog.
Frequent recategorizations may indicate that users struggle to select the correct service or category, leading to additional workload for agents. By analyzing this metric, service owners can identify opportunities to improve request form design, service taxonomy, and automation, ultimately reducing manual corrections and enhancing the overall request fulfillment process.
How it’s calculated
-
The metric counts the number of times a service desk agent modifies request form fields after the request submission.
-
A modification includes:
-
Value added when a previously empty field is populated.
-
Value modified when an existing field value is changed to a different value.
-
Value removed when a field’s value is cleared.
-
Fields used in Forms are not accounted for in this metric due to Jira limitations. Only modifications to standard request form fields are tracked.
Request form fields left empty
usability
Calculated based on data from the previous week
This metric tracks the number of service requests where one or more form fields were left empty by the user at the time of submission.
It helps assess the completeness of request submissions and provides insights into user behavior or potential issues with the request form.
Why This Metric Matters:
-
Accuracy & Completeness: Ensures that critical request information is provided, reducing back-and-forth communication.
-
Efficiency: Minimizes delays in request processing by identifying fields that may be unclear or unnecessary.
-
Form Optimization: Helps service owners refine request forms by adjusting, clarifying, or reconsidering frequently skipped fields.
By tracking empty fields, service owners can improve request form usability, enhance data accuracy, and streamline request handling.
How it’s calculated
-
The metric identifies fields that were left empty at the time of submission within the defined period
-
The top 10 most frequently empty fields are displayed, along with the number of requests in which each field was left blank
Requests with a Request Type change
efficiency
Calculated based on data from the previous week
This metric tracks the number of service requests where a service desk agent changed the request type after submission, more specifically, where the request type was changed to the current request type of the service request
Why this metric matters
✅ Identifies Misclassification Issues – Frequent changes to a different request type signal confusion in service categorization.
✅ Highlights Continuous Improvement Opportunities – A high number of changes to the current request type suggests misclassification of requests that need refinement across the catalog.
✅ Optimizes Agent Workflow – Helps reduce unnecessary manual reclassification and improve agent efficiency.
✅ Enhances User Experience – Provides insights to fine-tune the service catalog for easier self-service request submissions.
This metric helps streamline the request process and improve the accuracy of request type classifications over time.
How it’s calculated
The metric is calculated by counting the number of instances where a service desk agent changes the request type to the current one.
Requests cancelled by Agents
efficiency
Calculated based on data from the previous week
This metric tracks the number of service requests that have been cancelled by a service desk agent after submission. It helps assess the effectiveness and accuracy of the request process and provides insights into potential issues, such as unnecessary requests or incorrect submissions.
How it’s calculated
-
The metric counts the total number of requests that were cancelled by agents
-
It checks for requests in specific statuses that indicate cancellation. The following hard-coded statuses are tracked:
-
Cancelled
-
Canceled
-
Abandoned
-
Declined
-
Failed
-
Forms – Usability Metrics
These metrics help identify gaps in forms usability at submission, highlighting where agent intervention is frequently required. They can reveal training needs, form design issues, or opportunities to improve service request processes and reduce handling time.
Form Fields Left Unanswered
usability
Calculated based on data from the previous week
This metric highlights which Form fields are most frequently left blank by end users. It helps service owners identify fields that may be unclear, redundant, or poorly designed, allowing for targeted improvements in request forms to enhance usability and data completeness.
How it’s calculated
The metric evaluates all form fields presented to the end user at the time of submission, taking into account conditional display logic. It then computes:
-
The absolute number of unanswered fields across all requests submitted within the defined period.
-
The proportion of unanswered fields relative to the total number of fields displayed to end users, ensuring the metric reflects both scale and frequency of omission.
Forms reopened by Service Desk
efficiency
Calculated based on data from the previous week
This metric tracks how often forms attached to service requests are reopened by the Service Desk team due to missing or incomplete data. A high reopening rate signals that forms may be unclear, poorly structured, or lacking critical fields. By monitoring this metric, service owners can identify forms that generate unnecessary back-and-forth with end users, streamline data collection, and reduce delays in request fulfillment.
How it’s calculated
The metric counts the number of forms reopened by Service Desk agents after initial submission within the defined period. It also calculates the proportion of reopenings relative to the total number of form submissions, providing both absolute and relative measures of form quality and completeness.