
The Analysis Scope is the foundational filter for Elements Pulse. It allows you to define exactly which data subset you want to diagnose—whether that is specific departments, a set of JSM projects, or specific request types.
By creating a scope, you are telling Pulse to ingest and analyze up to 12 months of historical data and continue monitoring that specific segment daily.
Accessing the analysis scope
To define or manage your data segments, follow these steps:
-
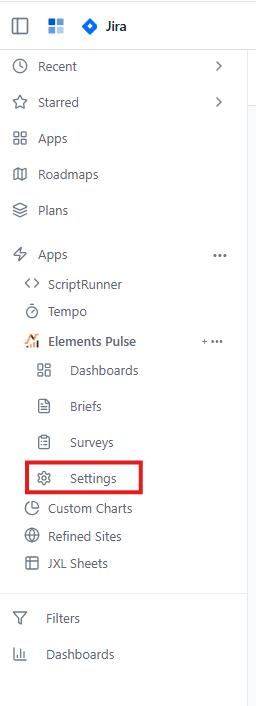
Open the Elements Pulse application from your Jira sidebar.
-
Expand the “Apps” section and navigate to Elements Pulse
-
Select Settings from the navigation menu.
-
On the Settings landing page, click the Analysis Scope card.
How it works
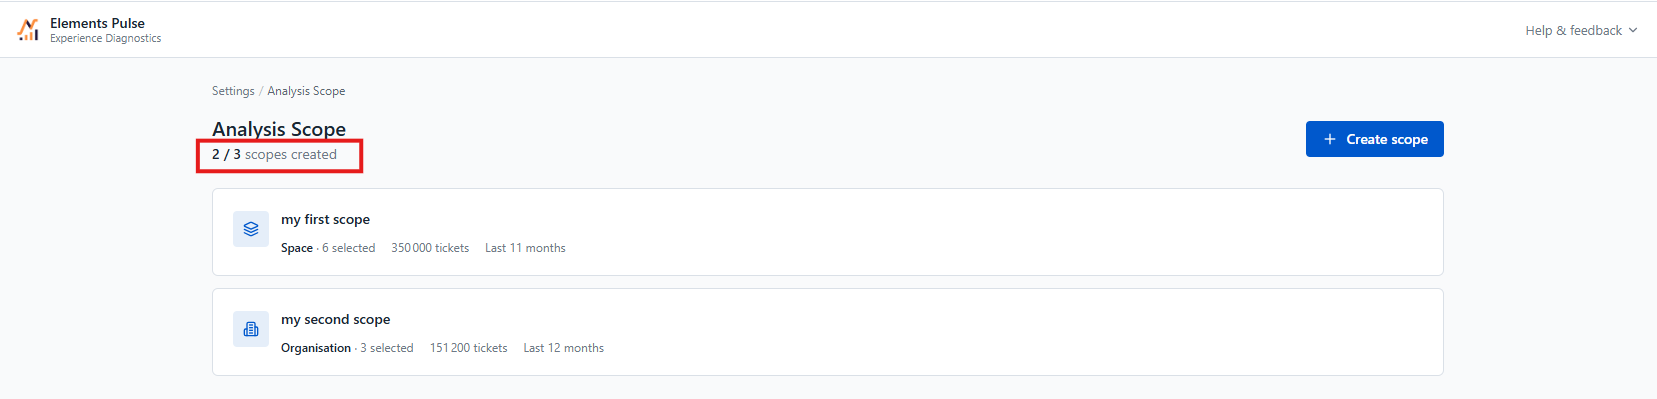
Pulse uses a "segmentation-first" approach. You can create up to three distinct scopes to organize your insights into different business contexts.
1. Segmentation options
To ensure your diagnostics are precise, you can segment your data using one of four mutually exclusive categories:
-
Space: Select specific Jira Service Management (JSM) projects.
-
Organization: Focus on data from specific JSM Customer Organizations.
-
Request Type: Drill down into specific service categories (e.g., "Onboarding" or "Hardware Requests") across all projects.
-
User Group: Analyze tickets created by specific Atlassian site user groups.
2. Understanding analysis capacity
To maintain high-performance diagnostics, each scope has a maximum capacity of 350,000 work items.
-
Under 350k work items: Pulse analyzes the full 12 months of historical data.
-
Over 350k work items: If your selection contains more than 350,000 tickets, Pulse employs "cap-and-trim" logic. It will prioritize the 350,000 most recent tickets and automatically reduce the time window (e.g., from 12 months to 9 months) to fit this limit. This ensures you are always looking at the most relevant, recent data.
The diagnostics experience
Saving an analysis scope runs the analysis against the specific scope and does a lot more than that—it encapsulates your entire diagnostic environment into a single, unified context. When you select a scope, the following sections are automatically synchronized:
Dashboards
The scope defines the boundaries for all your visual data. This includes:
-
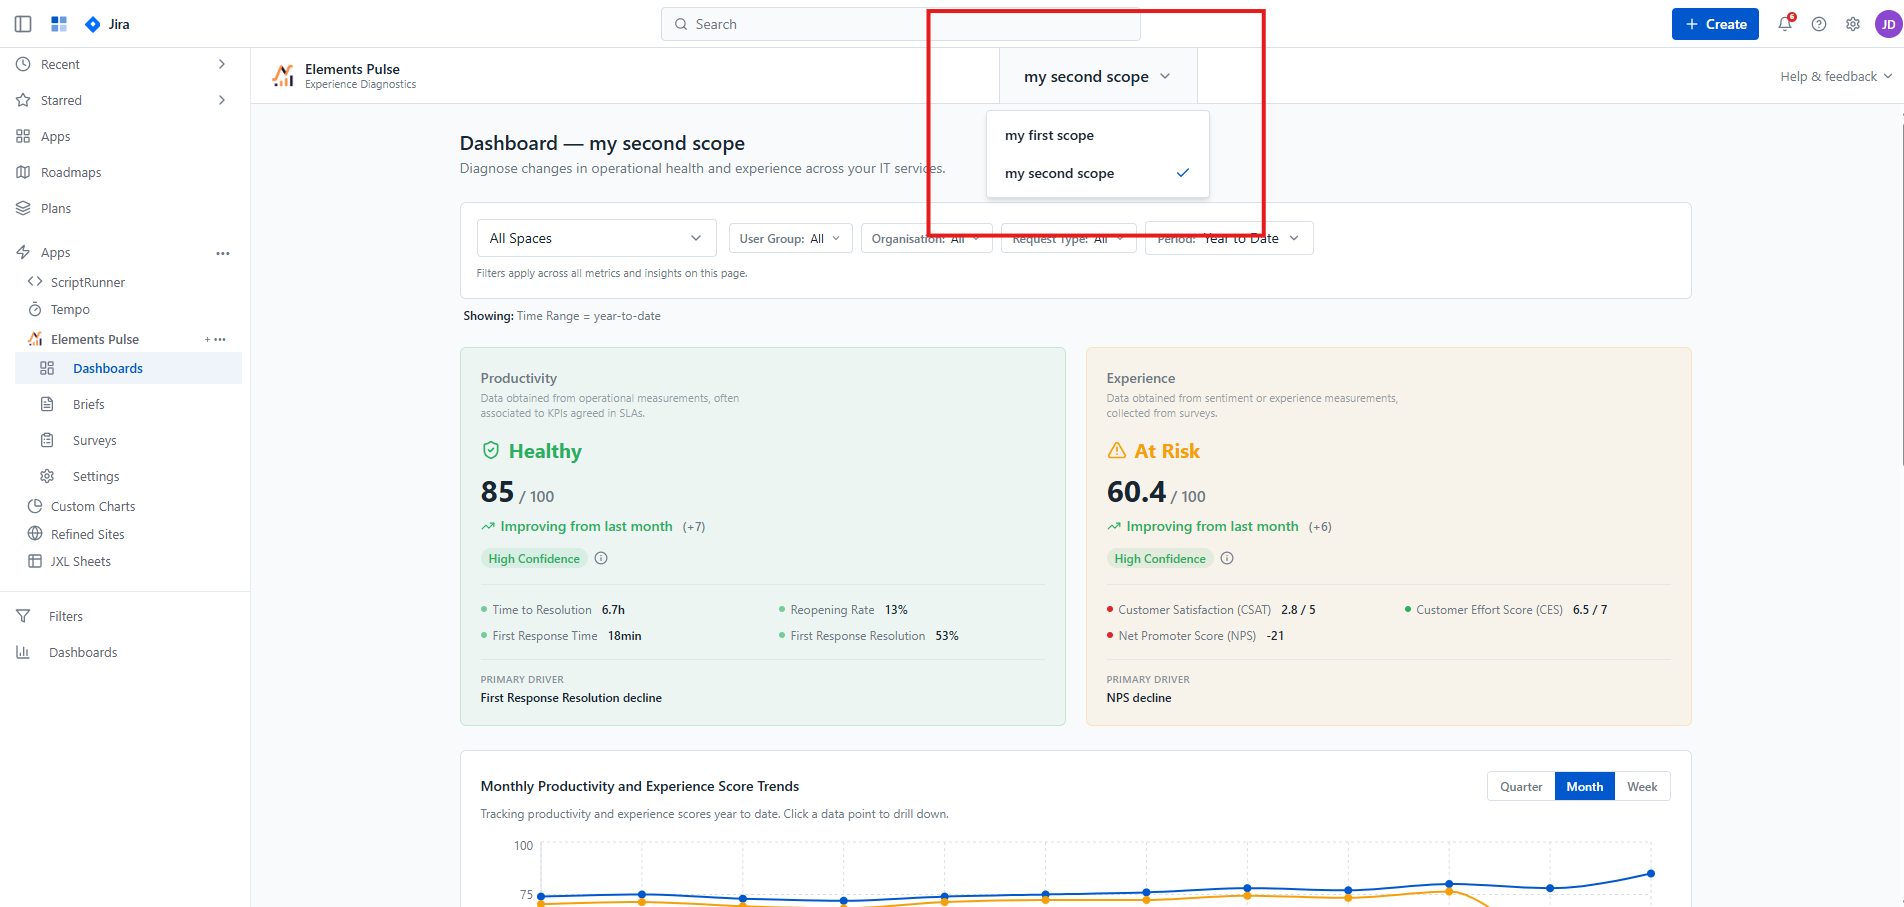
Core scores: Experience and Productivity scores are calculated exclusively from the tickets within your scope.
-
Contextual filters: All page-level filters (such as Space, Request Type, Organization, or User Group) are automatically limited to the items you selected during scope creation.
-
Drill-down views: Every detailed view or data point you investigate is strictly relevant to the active context, ensuring your deep-dive analysis remains focused.
Briefs
Briefs are on-demand diagnostic summaries for leadership.
-
The system automatically generates Briefs that correspond specifically to the active scope.
-
This ensures that when you switch from an "IT Support" scope to an "HR" scope, the monthly summaries pivot to reflect the unique service degradations or improvements of that specific area.
Managing scopes
-
The 1/3 rule: You can maintain a maximum of three scopes. Track your usage via the status indicator.
-
Switching contexts: Use the Scope switcher in the top navigation bar to toggle between saved scopes. The first scope in your list is selected by default upon login.
-
Breadcrumbs: Your active scope is always reflected in the breadcrumb path (
Dashboard / Analysis Scope / Experience Score), providing context.