
Quick answer
-
Build: give it a name and choose from five question types (CSAT, NPS, CES, rating scale, open text).
-
Schedule: optionally pick a start and end date.
-
Activate: review the summary and click Activate survey.
-
Distribute: create a rule that enables it when a ticket is resolved and shares the link with the employee.
-
Analyze: check the results and compare experience scores with JSM productivity metrics on the Elements Pulse Dashboard.
Can you create a survey natively in Jira?
JSM includes a built-in CSAT feature, but it is limited to a single satisfaction question per ticket. You cannot add NPS, effort scores, rating scales or several items in one form.
It is a frequent question on the Atlassian Community: how do you collect richer employee input than the native satisfaction rating allows?
Elements Pulse is a JSM app, published on the Atlassian Marketplace, that brings customizable, multi-question surveys to your IT help center.
With it you can:
-
Combine five question types, from CSAT and NPS to free-form comments.
-
Distribute automatically when a ticket is resolved, with Atlassian Automation.
-
Let employees and customers answer directly from the help center portal.
-
Analyze employee satisfaction alongside JSM operational metrics such as time to resolution, reopening rate and first response time.
Before you start
Make sure you have the following in place:
-
A JSM site on Atlassian Cloud.
-
Elements Pulse installed from the Atlassian Marketplace. Check the installation guide.
-
Access to Elements Pulse. Jira admins have it by default, other users must be granted the Elements Pulse Access permission (see App access management)
-
Permission to create rules in the JSM space you want to measure.
Step 1: Build your survey
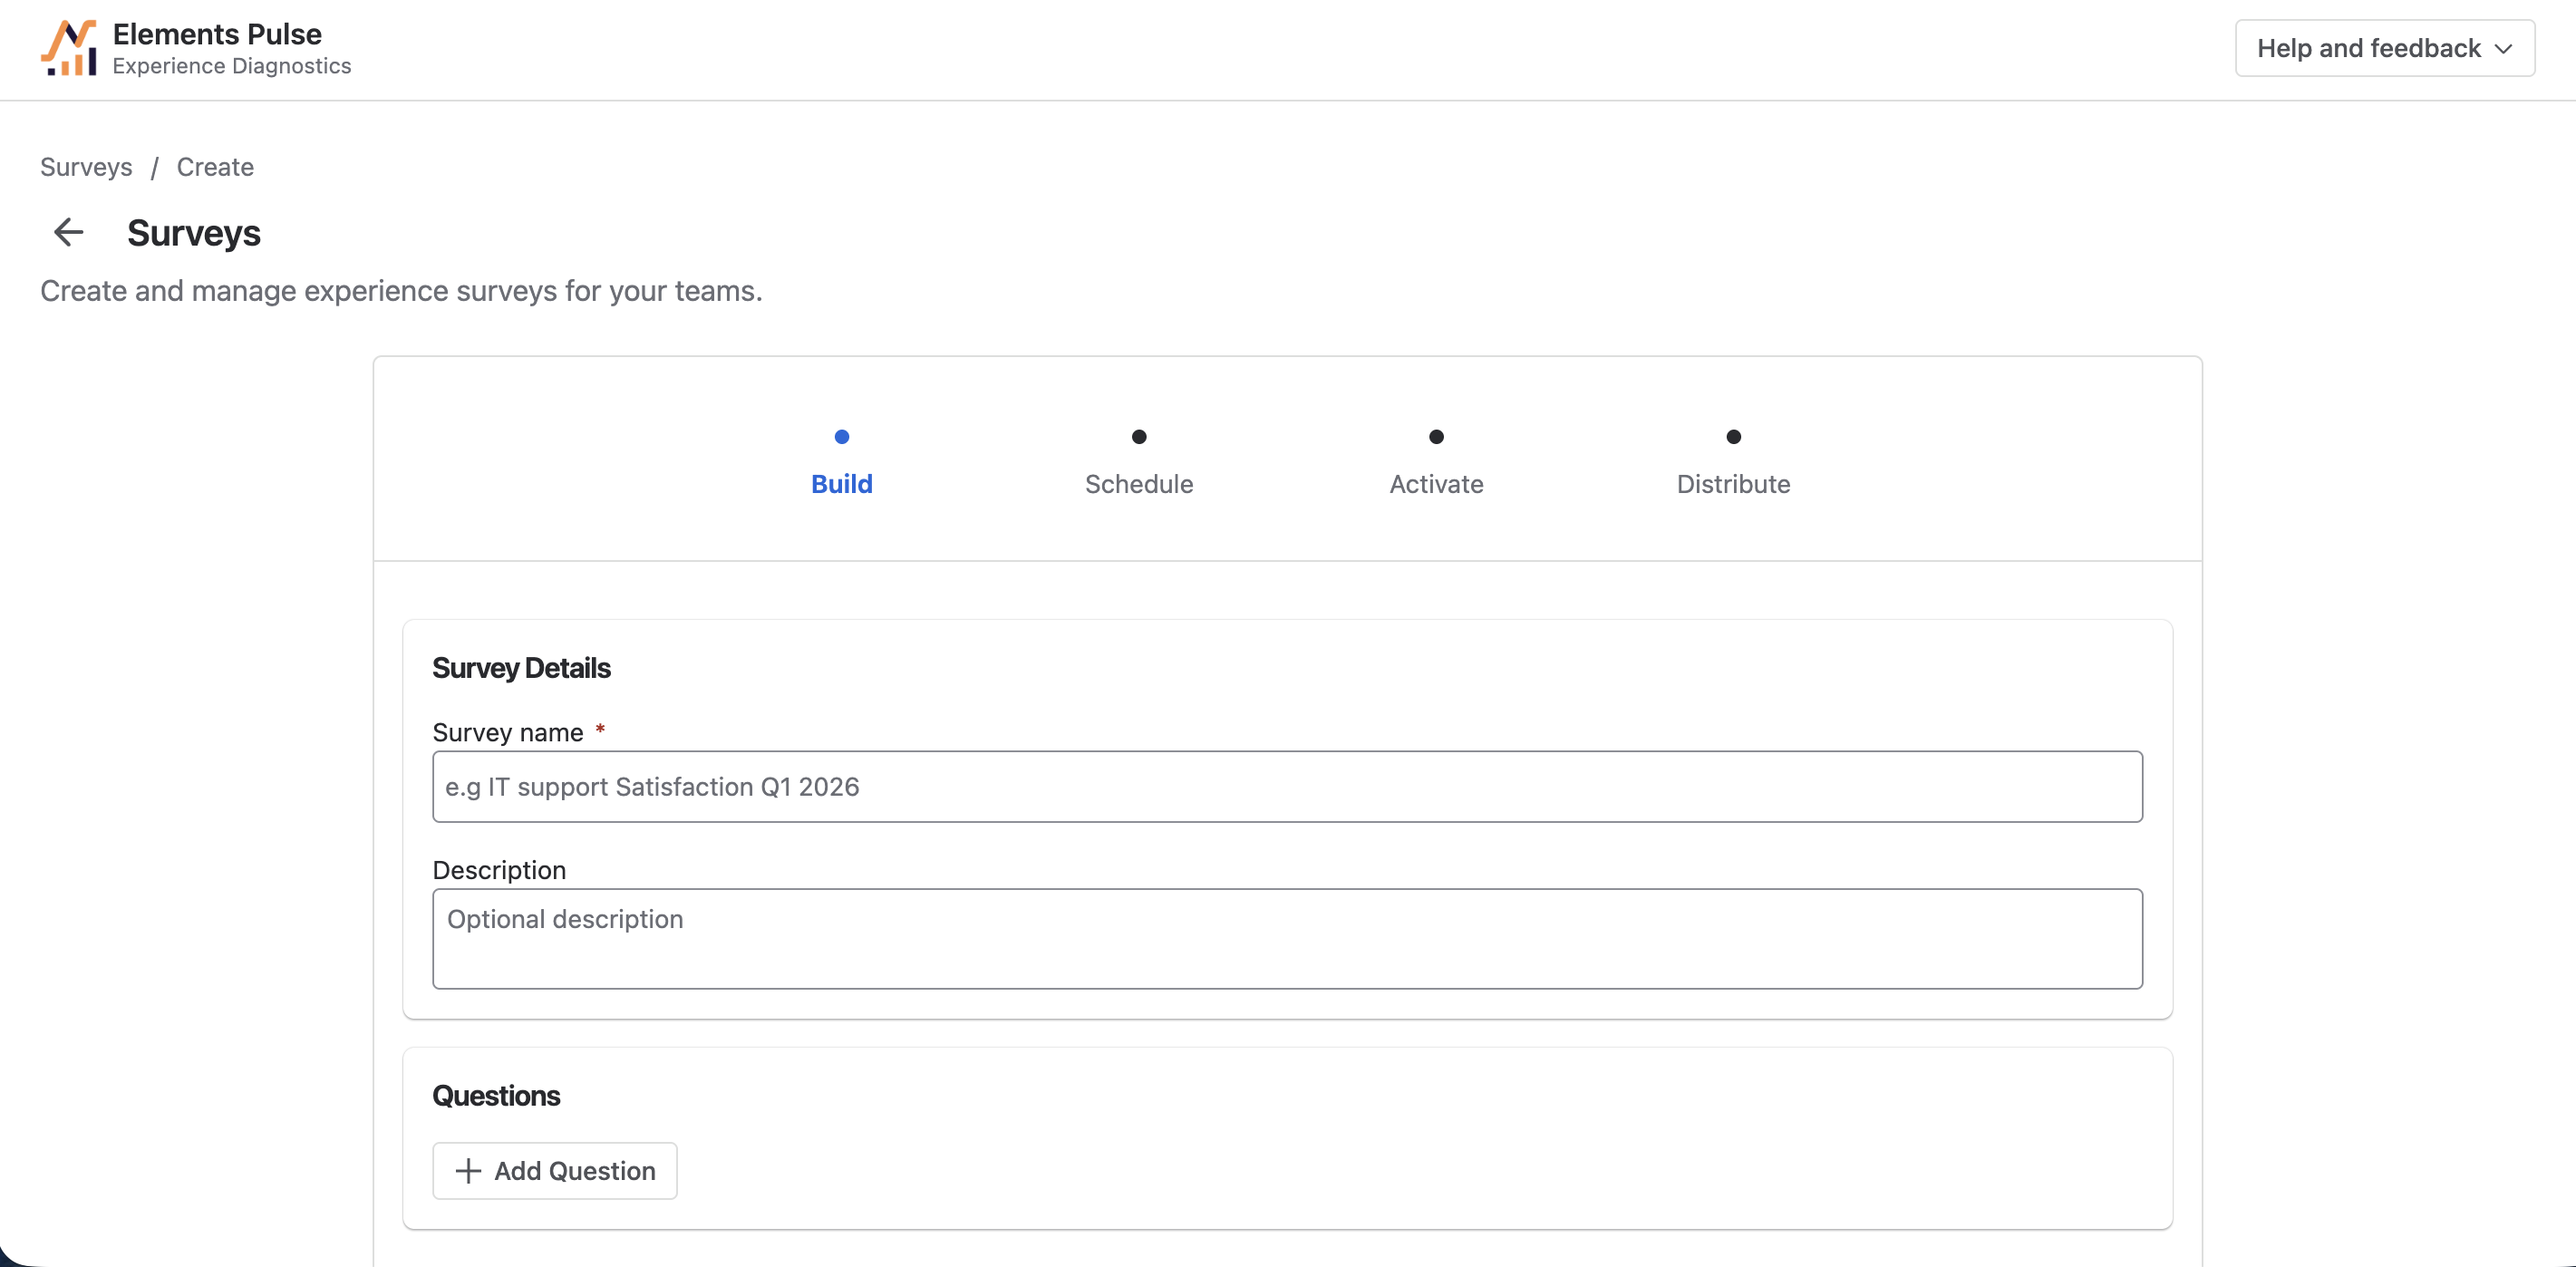
In Elements Pulse, open Surveys from the left-hand navigation and click + Create Survey. The guided creation flow opens on the Build step, where you build it from scratch.
-
Fill in two fields: a survey name (required) and an optional description so your team will know what it measures.
-
Open the Question Gallery and pick what to ask.
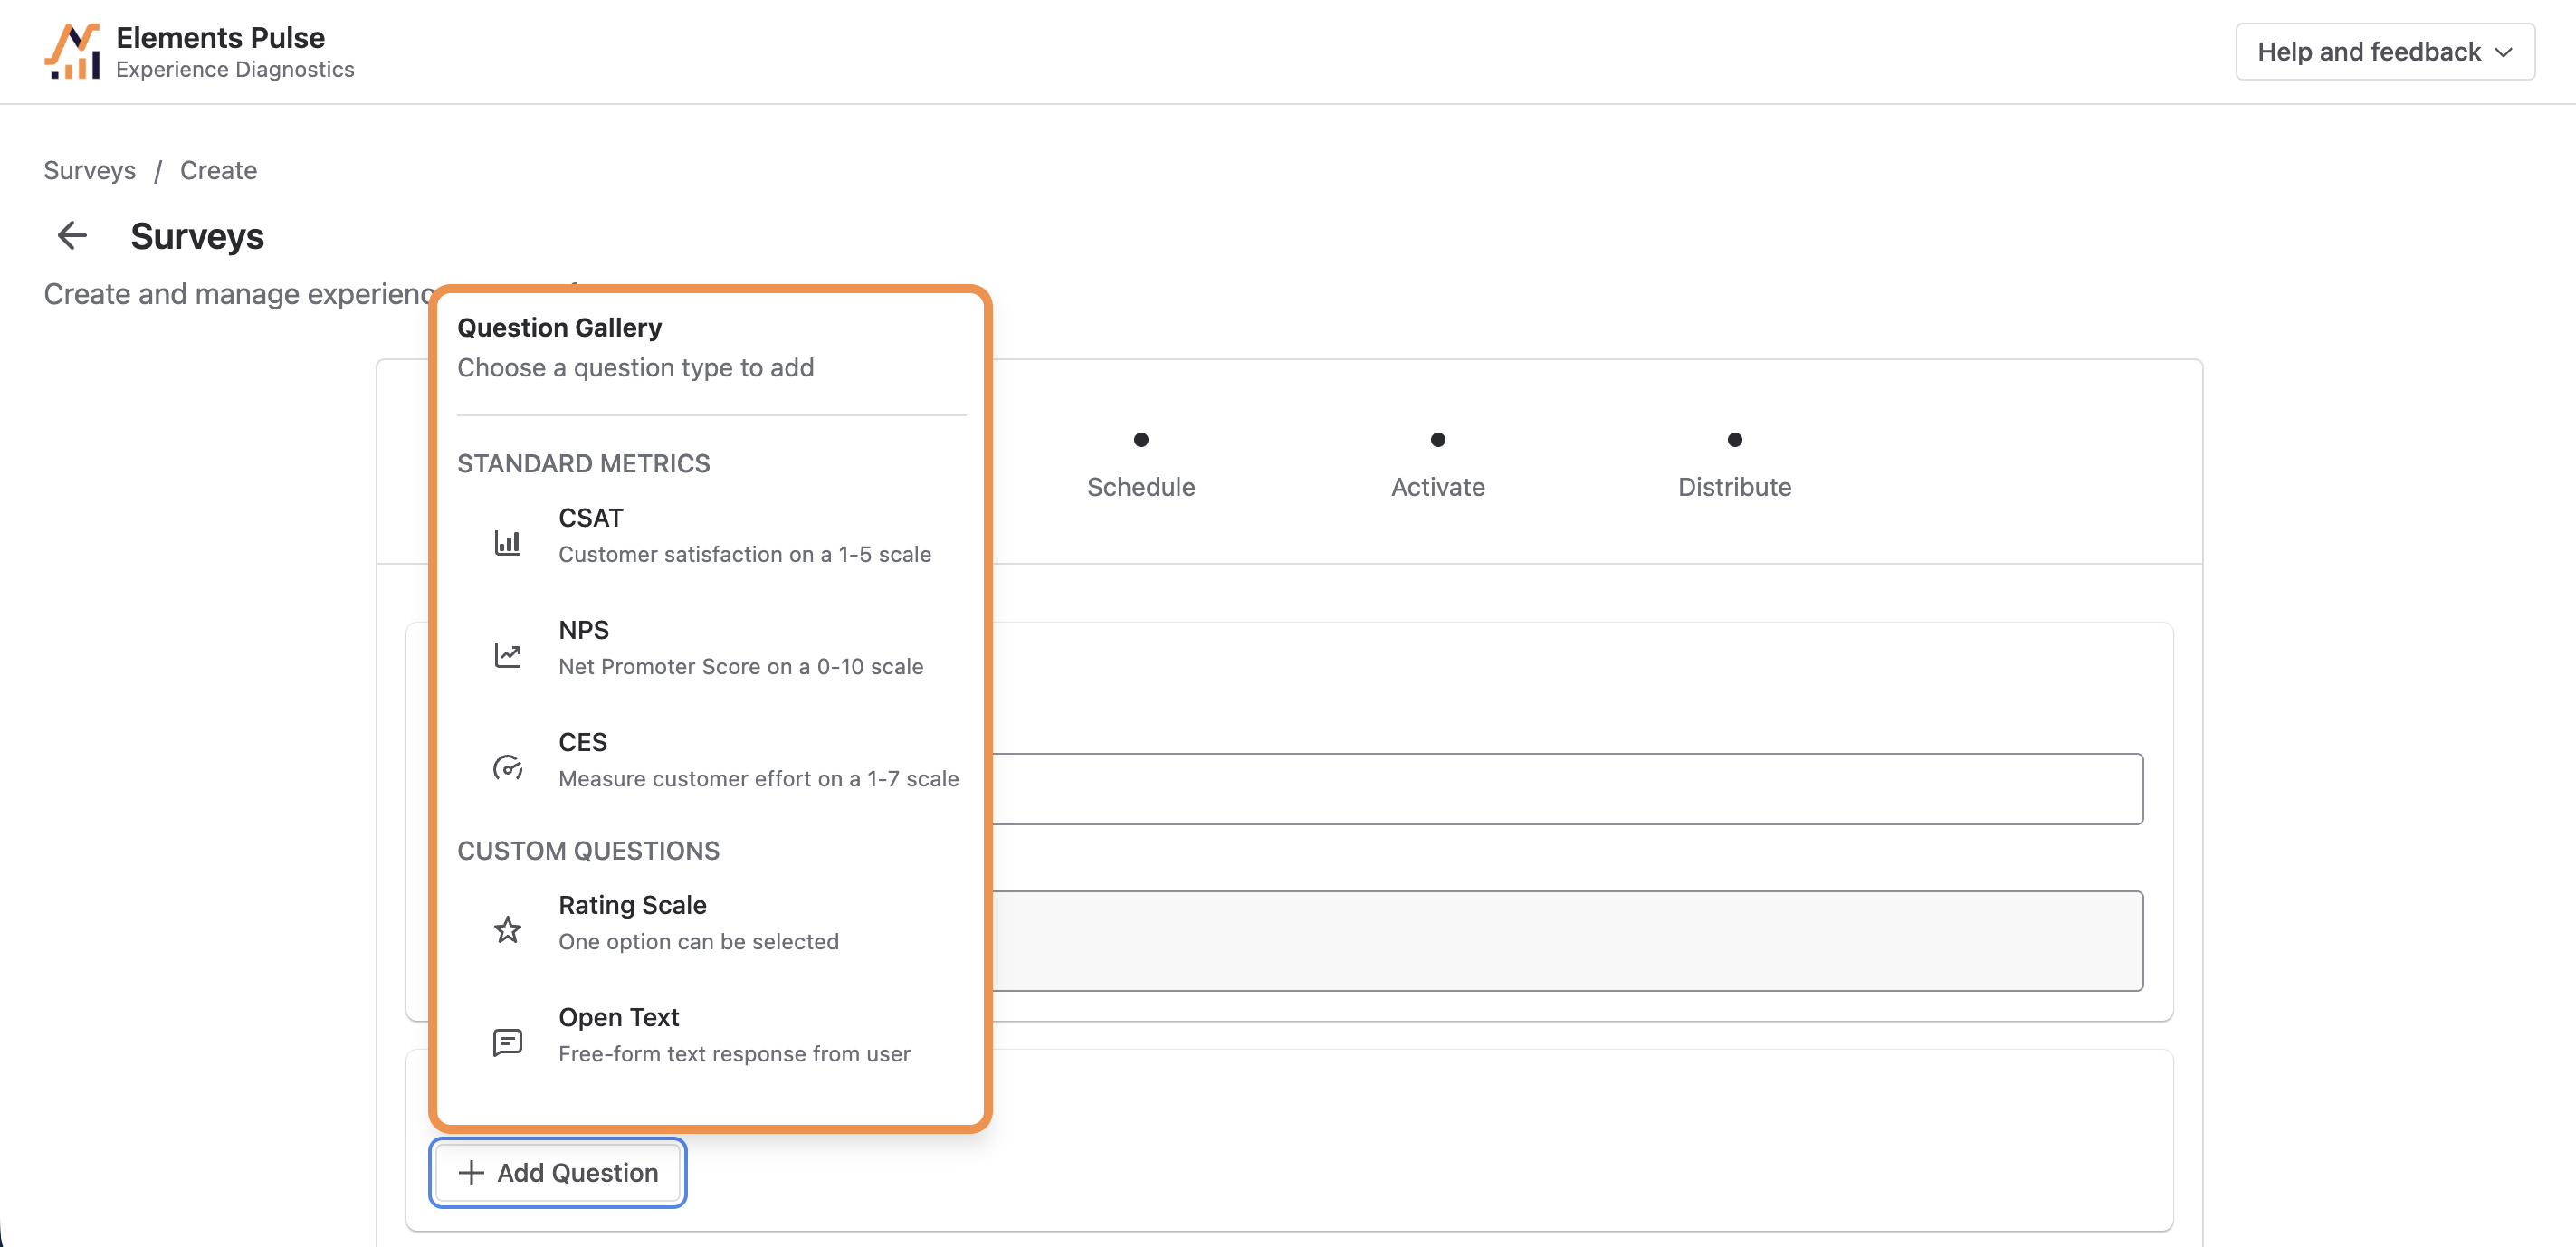
The Question Gallery is split into two sections of question types. You can mix several types.
|
Question type |
Category |
What it measures |
Scale |
|---|---|---|---|
|
CSAT |
Standard metric |
Customer satisfaction |
1–5 |
|
NPS |
Standard metric |
Net Promoter Score, likelihood to recommend |
0–10 |
|
CES |
Standard metric |
Effort needed to get the issue solved |
1–7 |
|
Rating scale |
Custom question |
Any numerical score you define |
1–5 or 1–10 |
|
Open text |
Custom question |
Free-form comments |
Free-form |
-
Click Preview at any time to see exactly what respondents will see. It stays in Draft until you activate it.
Tip: keep surveys short. Two or three items, for example one CSAT, one CES and one free-form field, give you a score, a reason and an explanation without discouraging respondents.
Step 2: Choose a schedule
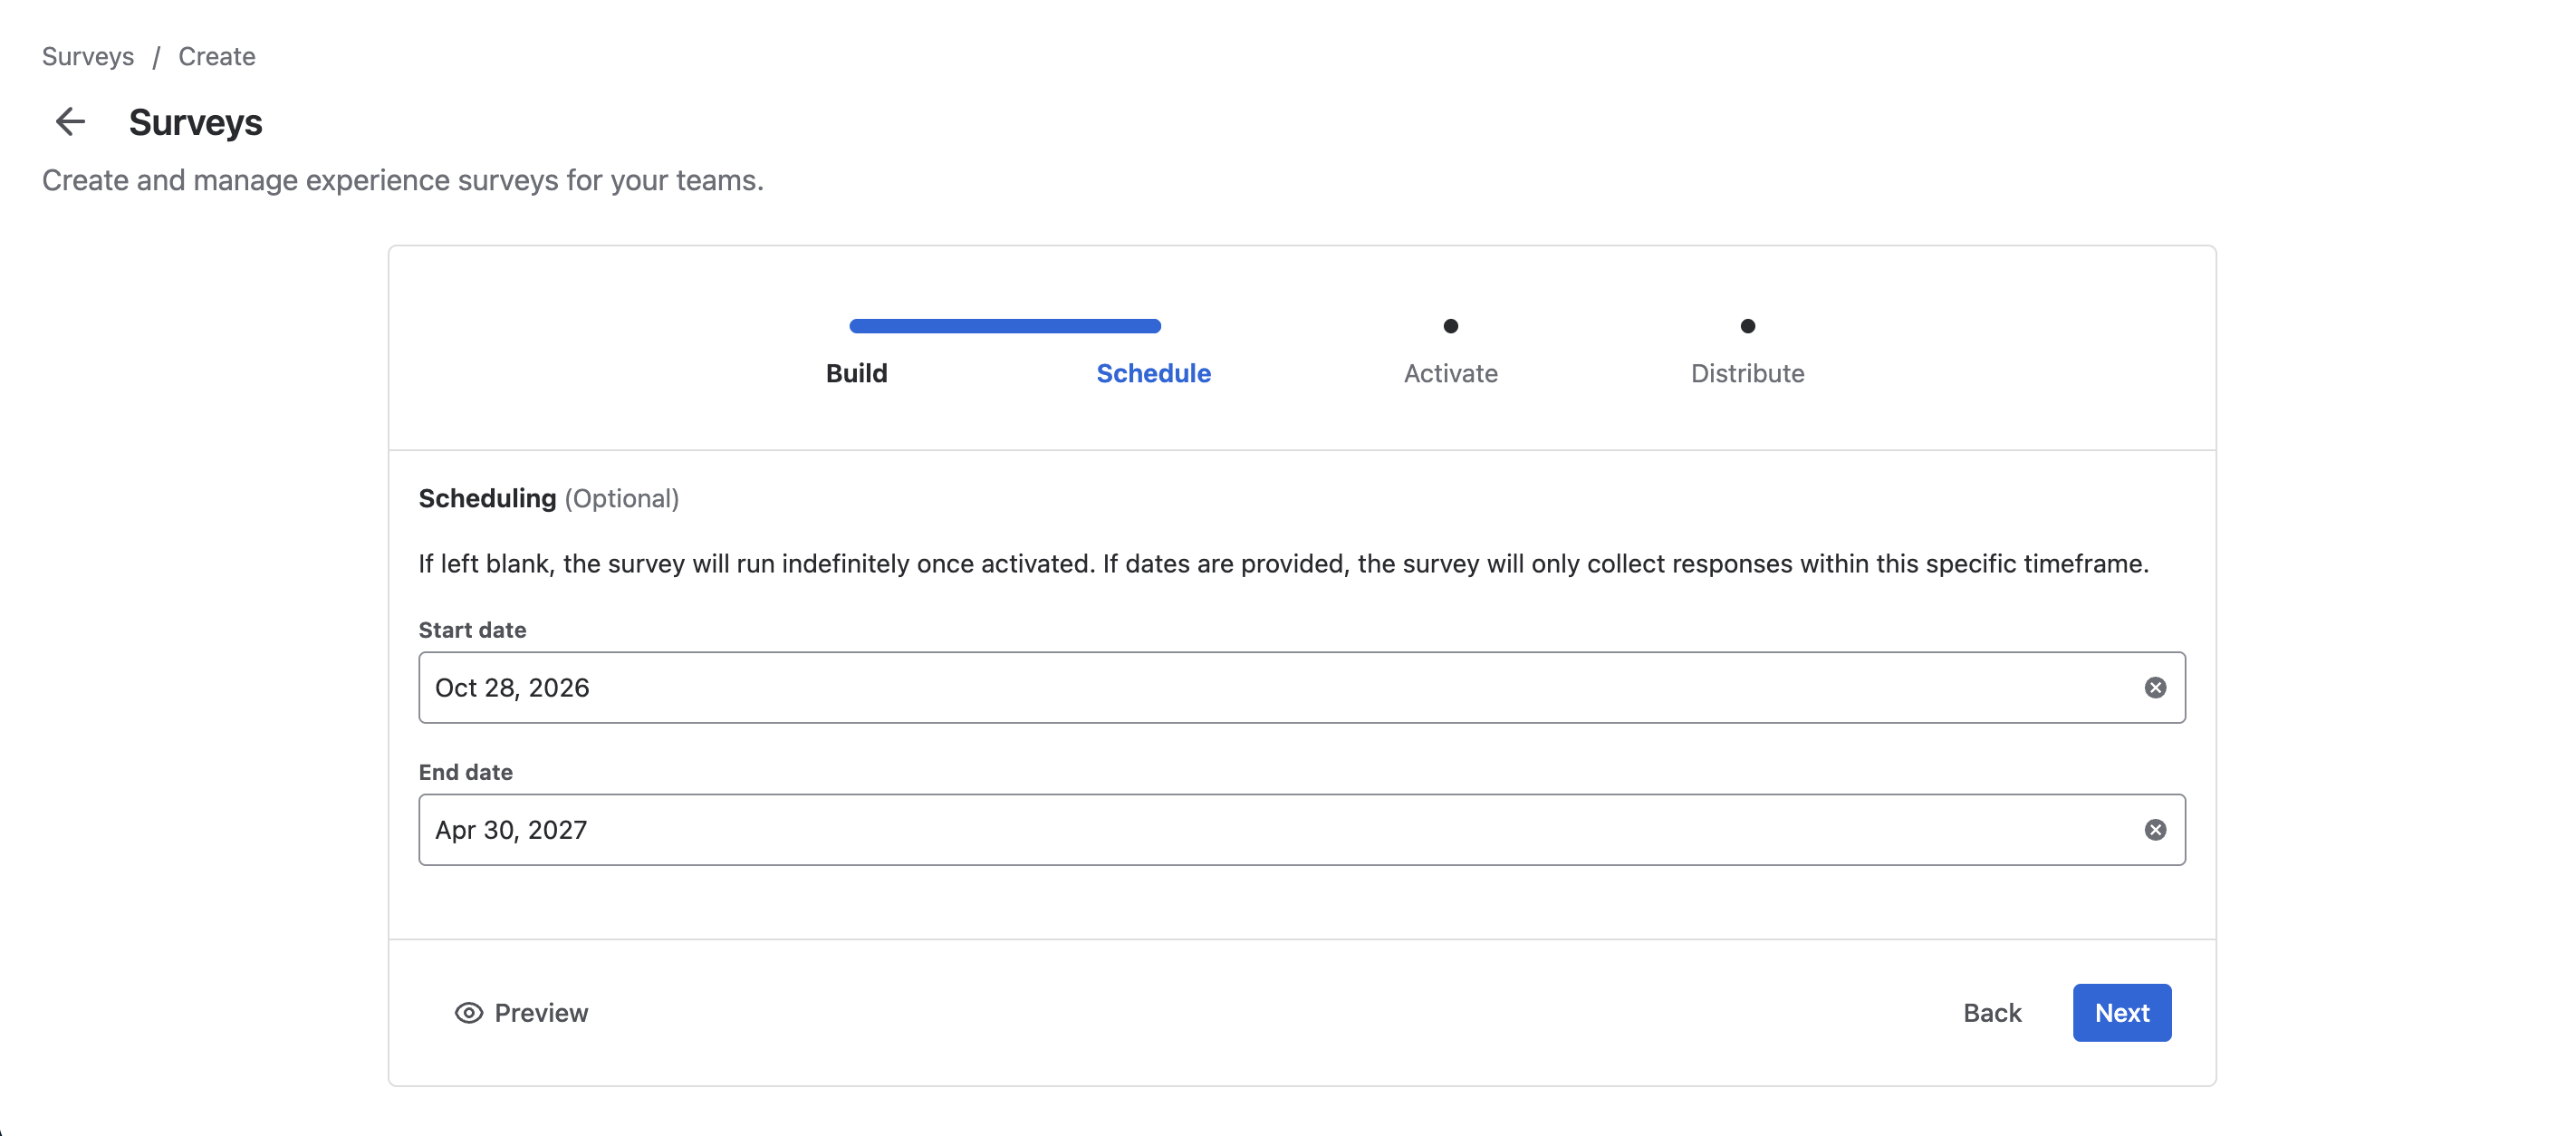
Scheduling is optional. Leave the dates blank and it runs indefinitely once activated.
To limit collection to a specific period, set a start date, an end date, or both, then click Next. It then shows as Scheduled and only collects answers within that timeframe. This is useful to measure a defined window, such as the first 90 days after a tool migration or the launch of an AI support agent.
Step 3: Activate and publish
Review the summary: name, number of questions and schedule. You can still edit it at this stage, as long as nobody has answered it yet.
When everything is correct, click Activate survey. Activating is how you publish it. It:
-
Moves it from Draft to Active, or to Scheduled if you chose a start date.
-
Makes it selectable when you configure distribution in the next step.
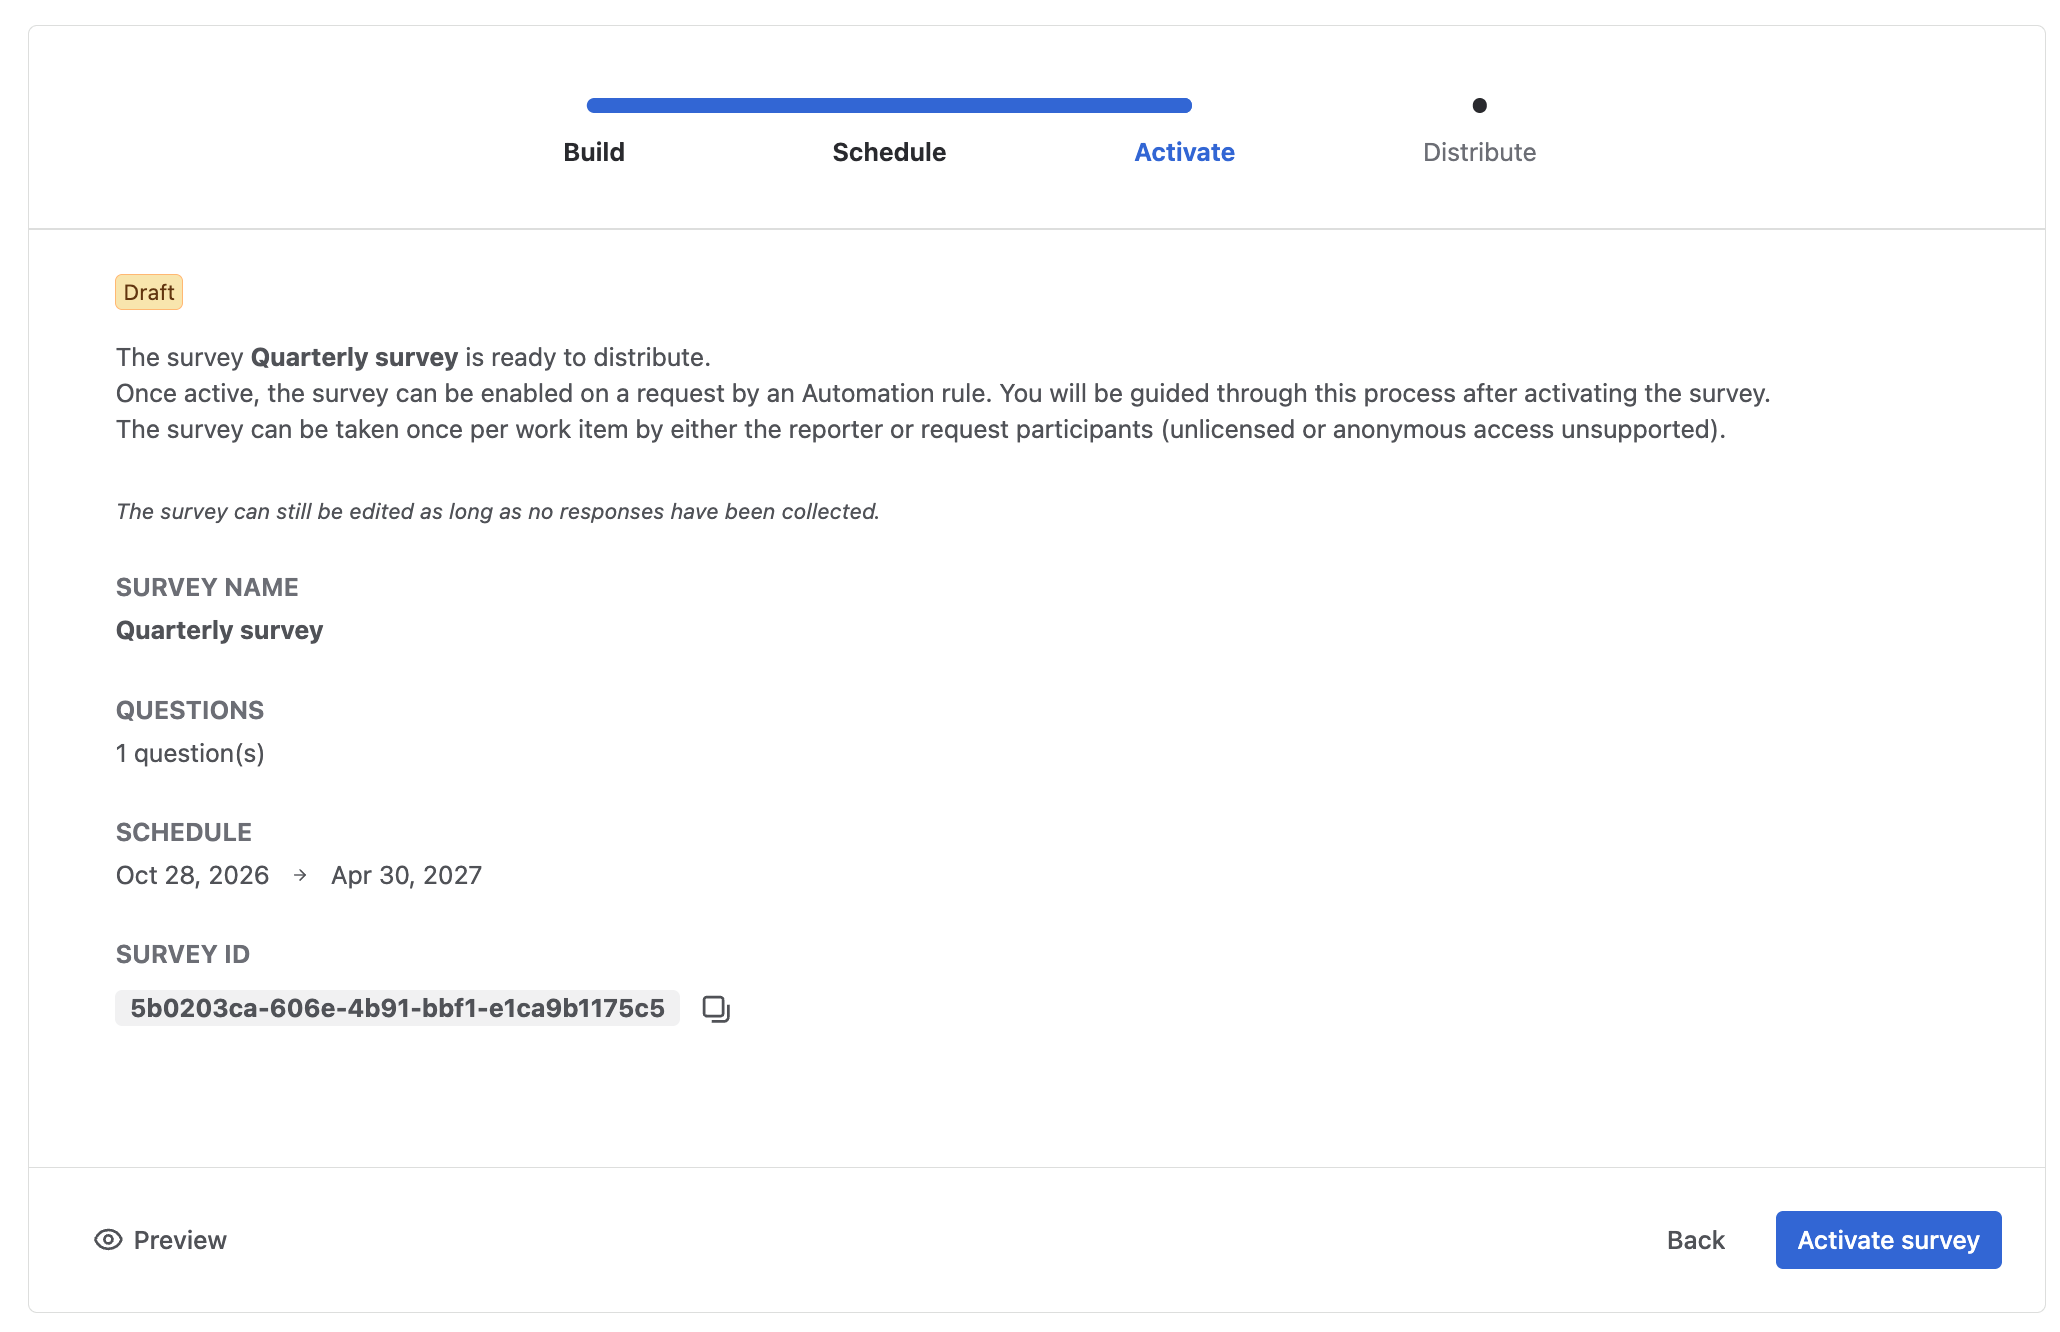
Important: activation does not share it with anyone. Nothing is collected until you configure distribution in Step 4.
📙 Check documentation about Jira survey configuration
Step 4: Send it to employees automatically
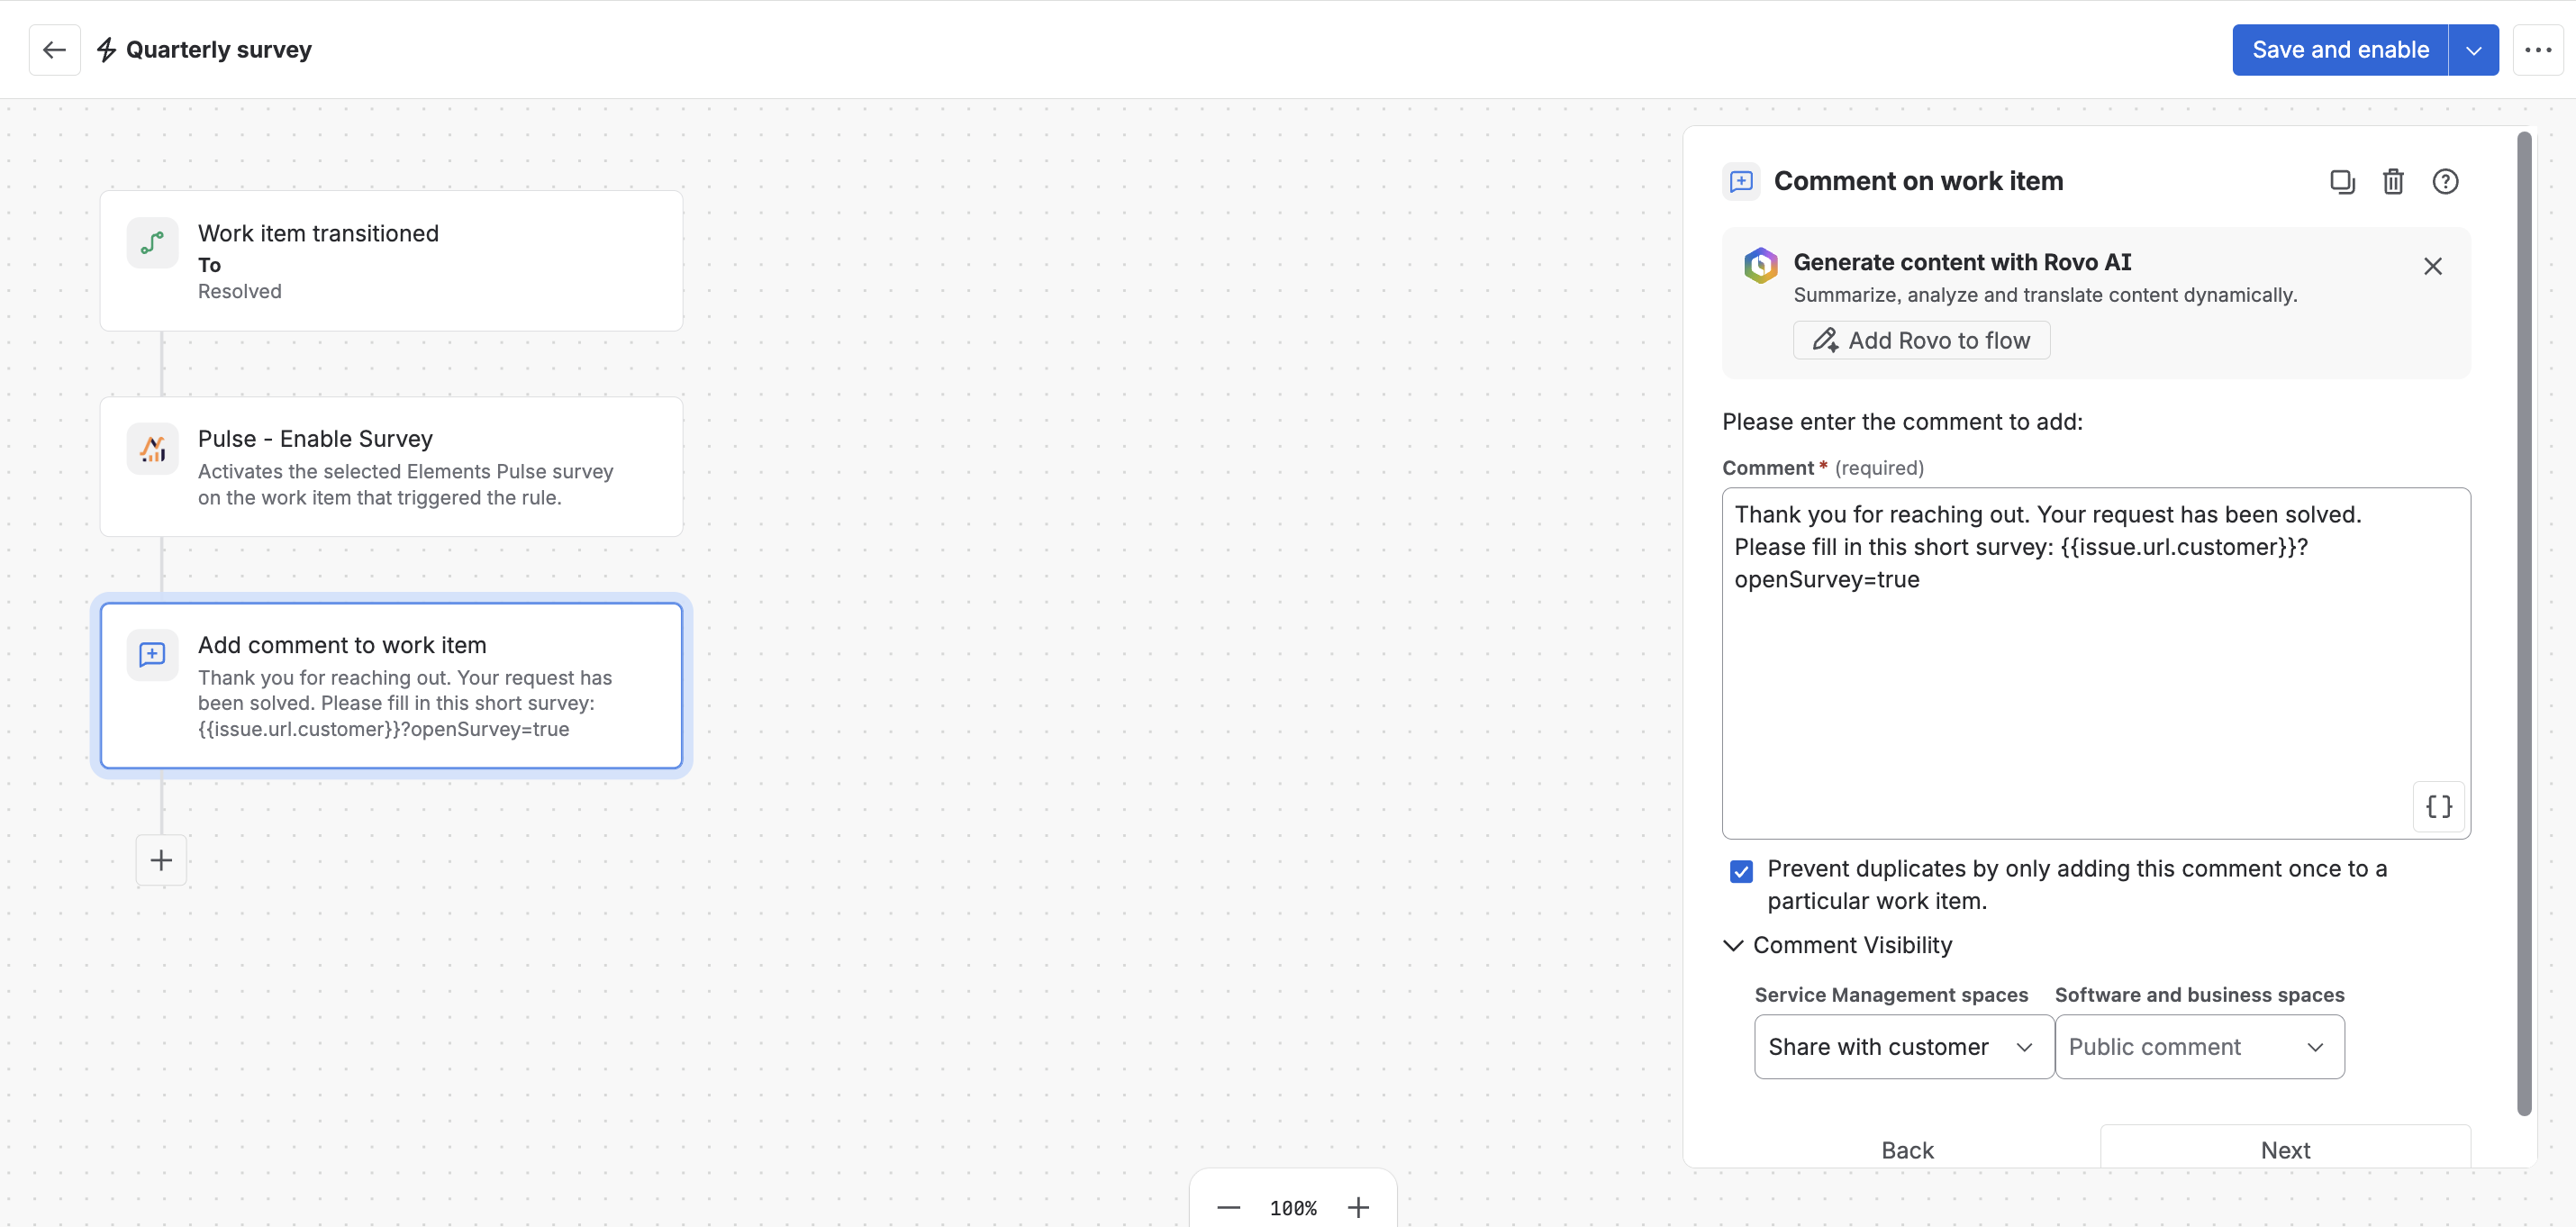
Once it is active, Elements Pulse guides you through an Automation rule that shares it with employees when their ticket is resolved.
-
Open the rule builder. Use the Open Automation Configuration shortcut, then create a new rule or update an existing one.
-
Select the trigger. Choose Work item transitioned and pick the target status that should enable it, typically Resolved.
-
Insert the Pulse action. Search for Pulse - Enable Survey and select the one to enable. Only Active or Scheduled surveys appear. An Answer survey button then shows directly on the ticket.
-
Notify the employee. Add a Comment on work item action, change its visibility to Share with customer and check Prevent duplicates so the message is posted only once per ticket. JSM usually includes it in its email notification to the reporter.
-
Write the message. Include the link
{{issue.url.customer}}?openSurvey=true. Click Copy message template for a ready-made starting point, then adapt the wording to your tone. -
Turn on the rule. From now on, every resolved ticket in scope will invite the employee to answer.
Employees can also open it at any time with the Answer survey button on their ticket. The link is a shortcut, not the only way in. You can reopen this guide from the list whenever you need it.
Example message template:
Hi {{reporter.displayName}},

Your ticket has been resolved. Could you take 30 seconds to tell us how it went?

👉 Answer here: {{issue.url.customer}}?openSurvey=true

Your answers help us improve our IT services. Thank you!
📙 Read more about Automation configuration to send your survey
Step 5: Check the results and compare them with productivity metrics
Once answers come in, review the results in Elements Pulse, then compare satisfaction scores with JSM operational metrics on the Dashboard. This shows where green SLAs hide a poor employee experience, also called the watermelon effect.
Check your results
-
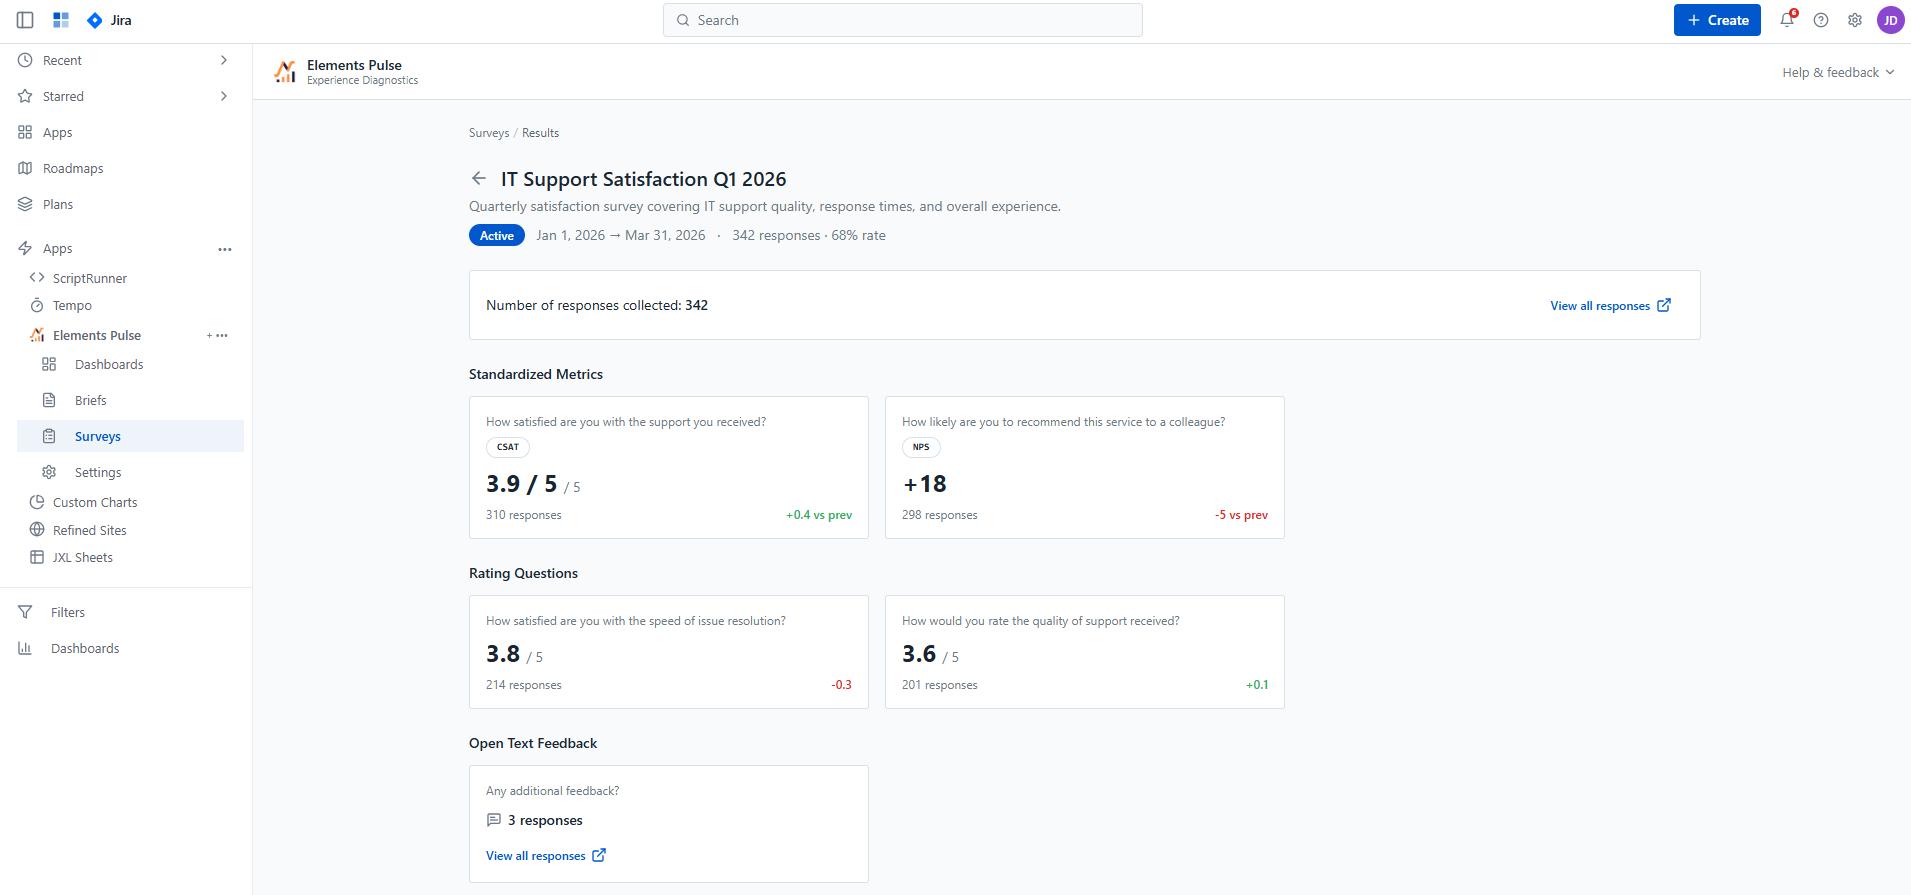
Open the survey list. Go to Surveys in the Elements Pulse menu, where you manage them all. Each one shows its status, start and end date, number of responses and response rate.
-
Open the results page. Click a name. The page is organized in three sections: Standardized Metrics (CSAT, NPS, CES), Rating Questions and Open Text Feedback. Each score card shows the average score, the answer count and the trend versus the previous period.
-
Drill down into a question. Click a question card to see the Score Distribution and a response table you can filter by score, Organisation, Space, Request Type and date range.
-
Read individual answers. Click View all responses to open the response log, then any row to see the full Response Details. Every ticket reference links back to the original JSM ticket.
Compare employee satisfaction with productivity metrics
-
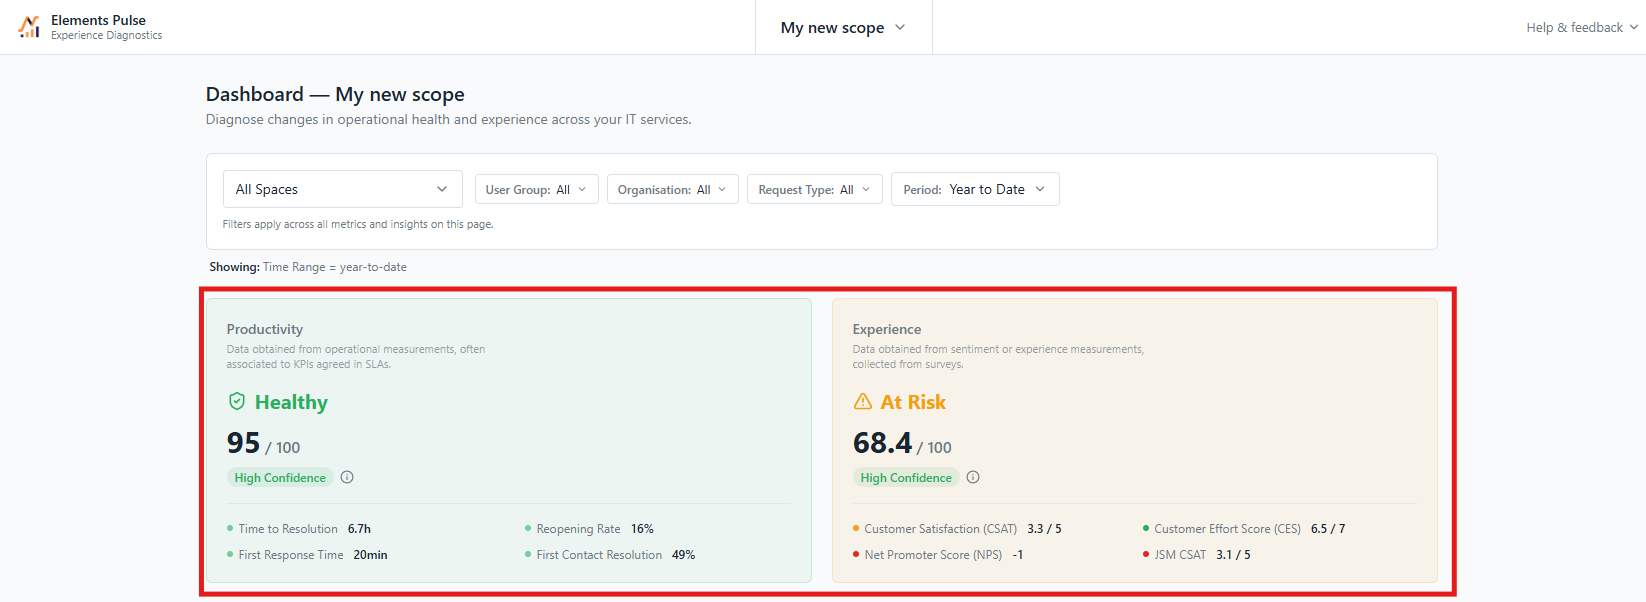
Open the Dashboard. Go to Dashboards in the Elements Pulse menu. Use the filter bar to narrow results by Spaces, User Group, Organisation, Request Type and Period.
-
Read the score cards. Check your Productivity score (from JSM operational metrics) and your Experience score (from employee answers) side by side.
📙 Read more about how to interpret scores
-
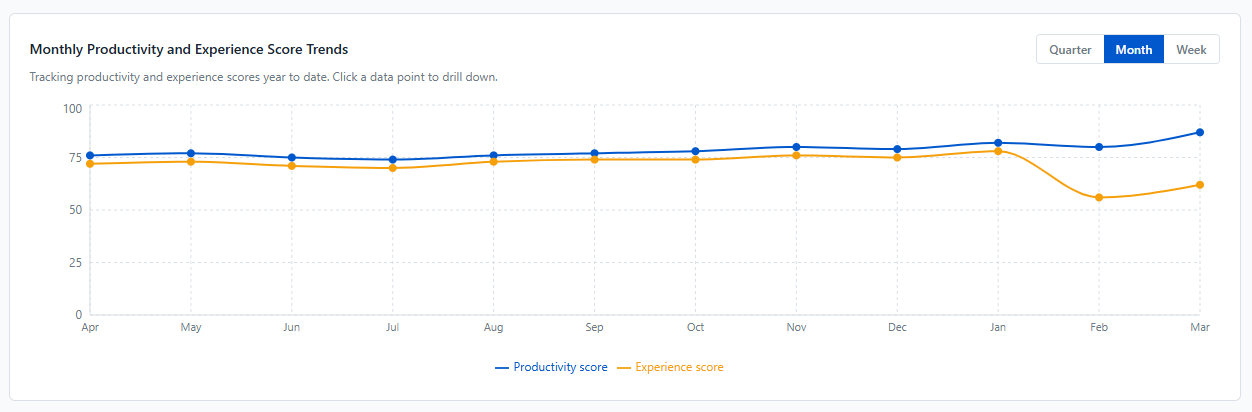
Follow the score trends. The trend chart plots both scores over time, by quarter, month or week. A stable Productivity score with a falling Experience score is a warning sign.
-
Find where to focus with the Focus Area Quadrant. It places each space, user group, organisation or request type in one of four zones. Switch the grouping with the Group by menu.
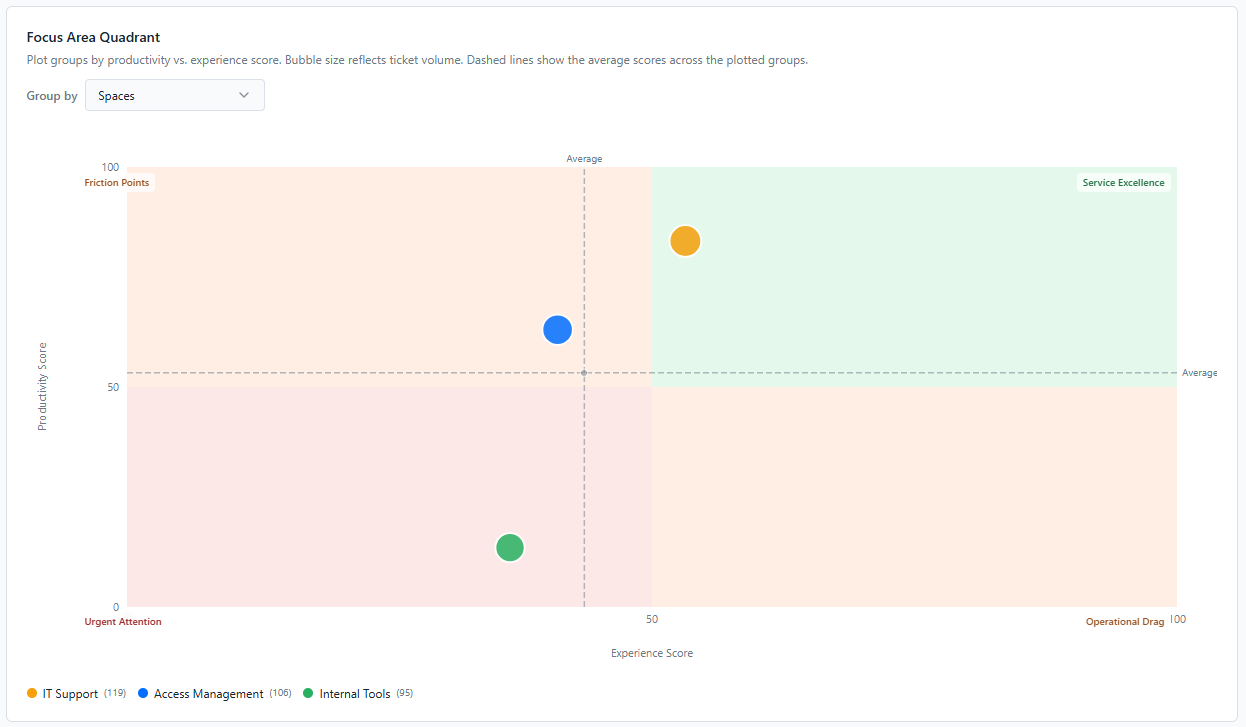
-
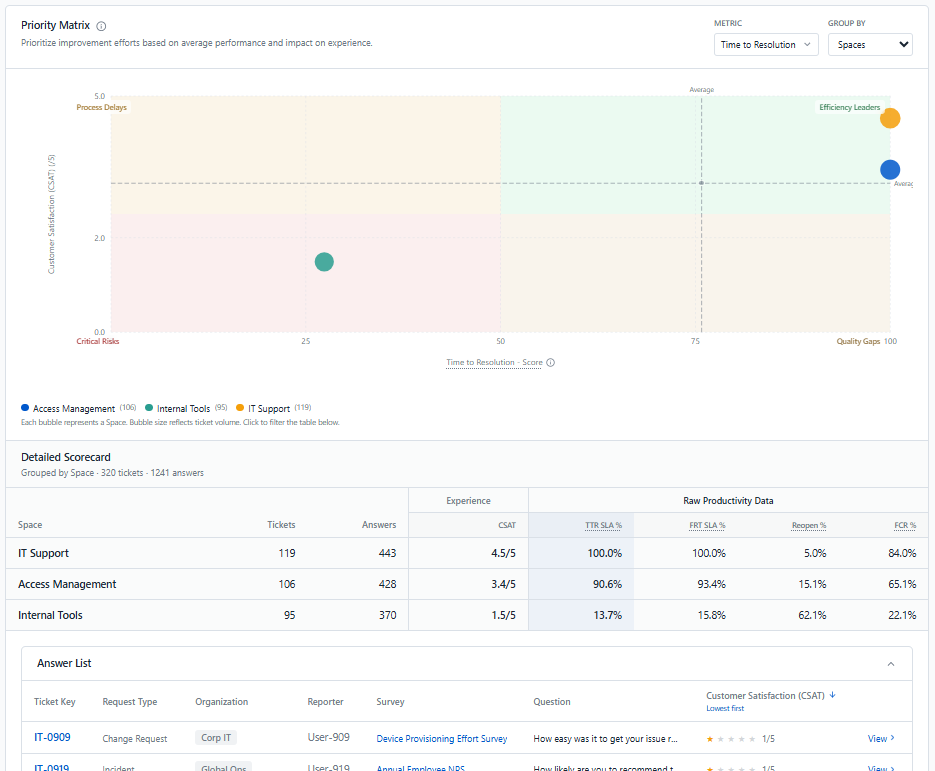
Investigate with the Priority Matrix. On the CSAT, CES and NPS deep dive pages, compare the score with one operational indicator: Time to Resolution, First Response Time, Reopening Rate or First Contact Resolution. Select a group to see its Answer List, lowest scores first, each linked to its ticket.
|
Focus Area zone |
Productivity |
Experience |
What it means |
|---|---|---|---|
|
Service Excellence |
Good |
Good |
Keep it up. |
|
Friction Points |
Good |
Weak |
Efficient, but employees are unhappy. Investigate the gap. |
|
Operational Drag |
Weak |
Good |
Employees are satisfied, but the service underperforms operationally. |
|
Urgent Attention |
Weak |
Weak |
Address these groups first. |
Note: the Focus Area Quadrant and the Priority Matrix only follow the Period filter and their own Group by menu. The Priority Matrix on the CSAT page uses Pulse CSAT answers only, not native JSM CSAT ratings. The Dashboard only shows tickets inside the Analysis Scope defined in Settings.
📙 Learn more about correlating metrics
Best practices for surveys that get answers
-
Ask at the right moment. Send it on resolution, while the experience is still fresh.
-
Keep it short. Three items or fewer keeps completion high.
-
Pair a score with a why. Follow each CSAT, NPS or CES score with a free-form field to understand the reason behind the rating.
-
Write a friendly message. The message is visible to the employee; a clear, personal tone helps people take the time to answer.
-
Respect your privacy policy. Each answer is linked to the respondent and the ticket, so tell employees how their answers will be used and follow your company's privacy policy.
-
Use one survey per goal. Make separate ones to measure different services or initiatives, and schedule them to compare periods.
-
Check before activating. Review wording and order in Preview, because editing stops once the first answer comes in.
Frequently asked questions
Can I create a survey in Jira without an app?
Yes, but JSM only offers a native single-question CSAT rating. To build one with multiple items or with NPS and CES, you need a Marketplace add-on such as Elements Pulse.
Which question types can I use?
Elements Pulse supports CSAT (1–5), NPS (0–10), CES (1–7), rating scales (1–5 or 1–10) and open text. You can combine them.
How do I share a survey automatically when a ticket is resolved?
Create an Automation rule that runs when a ticket moves to Resolved, use the Pulse - Enable Survey action, then post a comment shared with the customer that contains the link.
Does activating a survey share it with employees?
No. Activation only makes it available. Feedback is collected once a rule enables it on tickets.
Can I edit a survey after it is activated?
Yes, as long as nobody has answered it yet.
Can I run a survey for a limited period?
Yes. Pick a start date and an end date in the Schedule step. It only collects answers within that window.
Where do employees answer?
In the JSM help center portal, either from the link shared on the ticket or with the Answer survey button on the ticket.
How do I compare survey results with ticket performance?
Open the Elements Pulse Dashboard. It shows a Productivity score from JSM operational metrics next to an Experience score from your surveys. The Focus Area Quadrant and the Priority Matrix show which spaces or teams have good SLAs but unhappy employees.
Is Elements Pulse available on Jira Cloud?
Yes. It is available for JSM on the Atlassian Marketplace.