Configuration tester
Definition
The Configuration tester is a tool available on the right part of the field configuration screen:
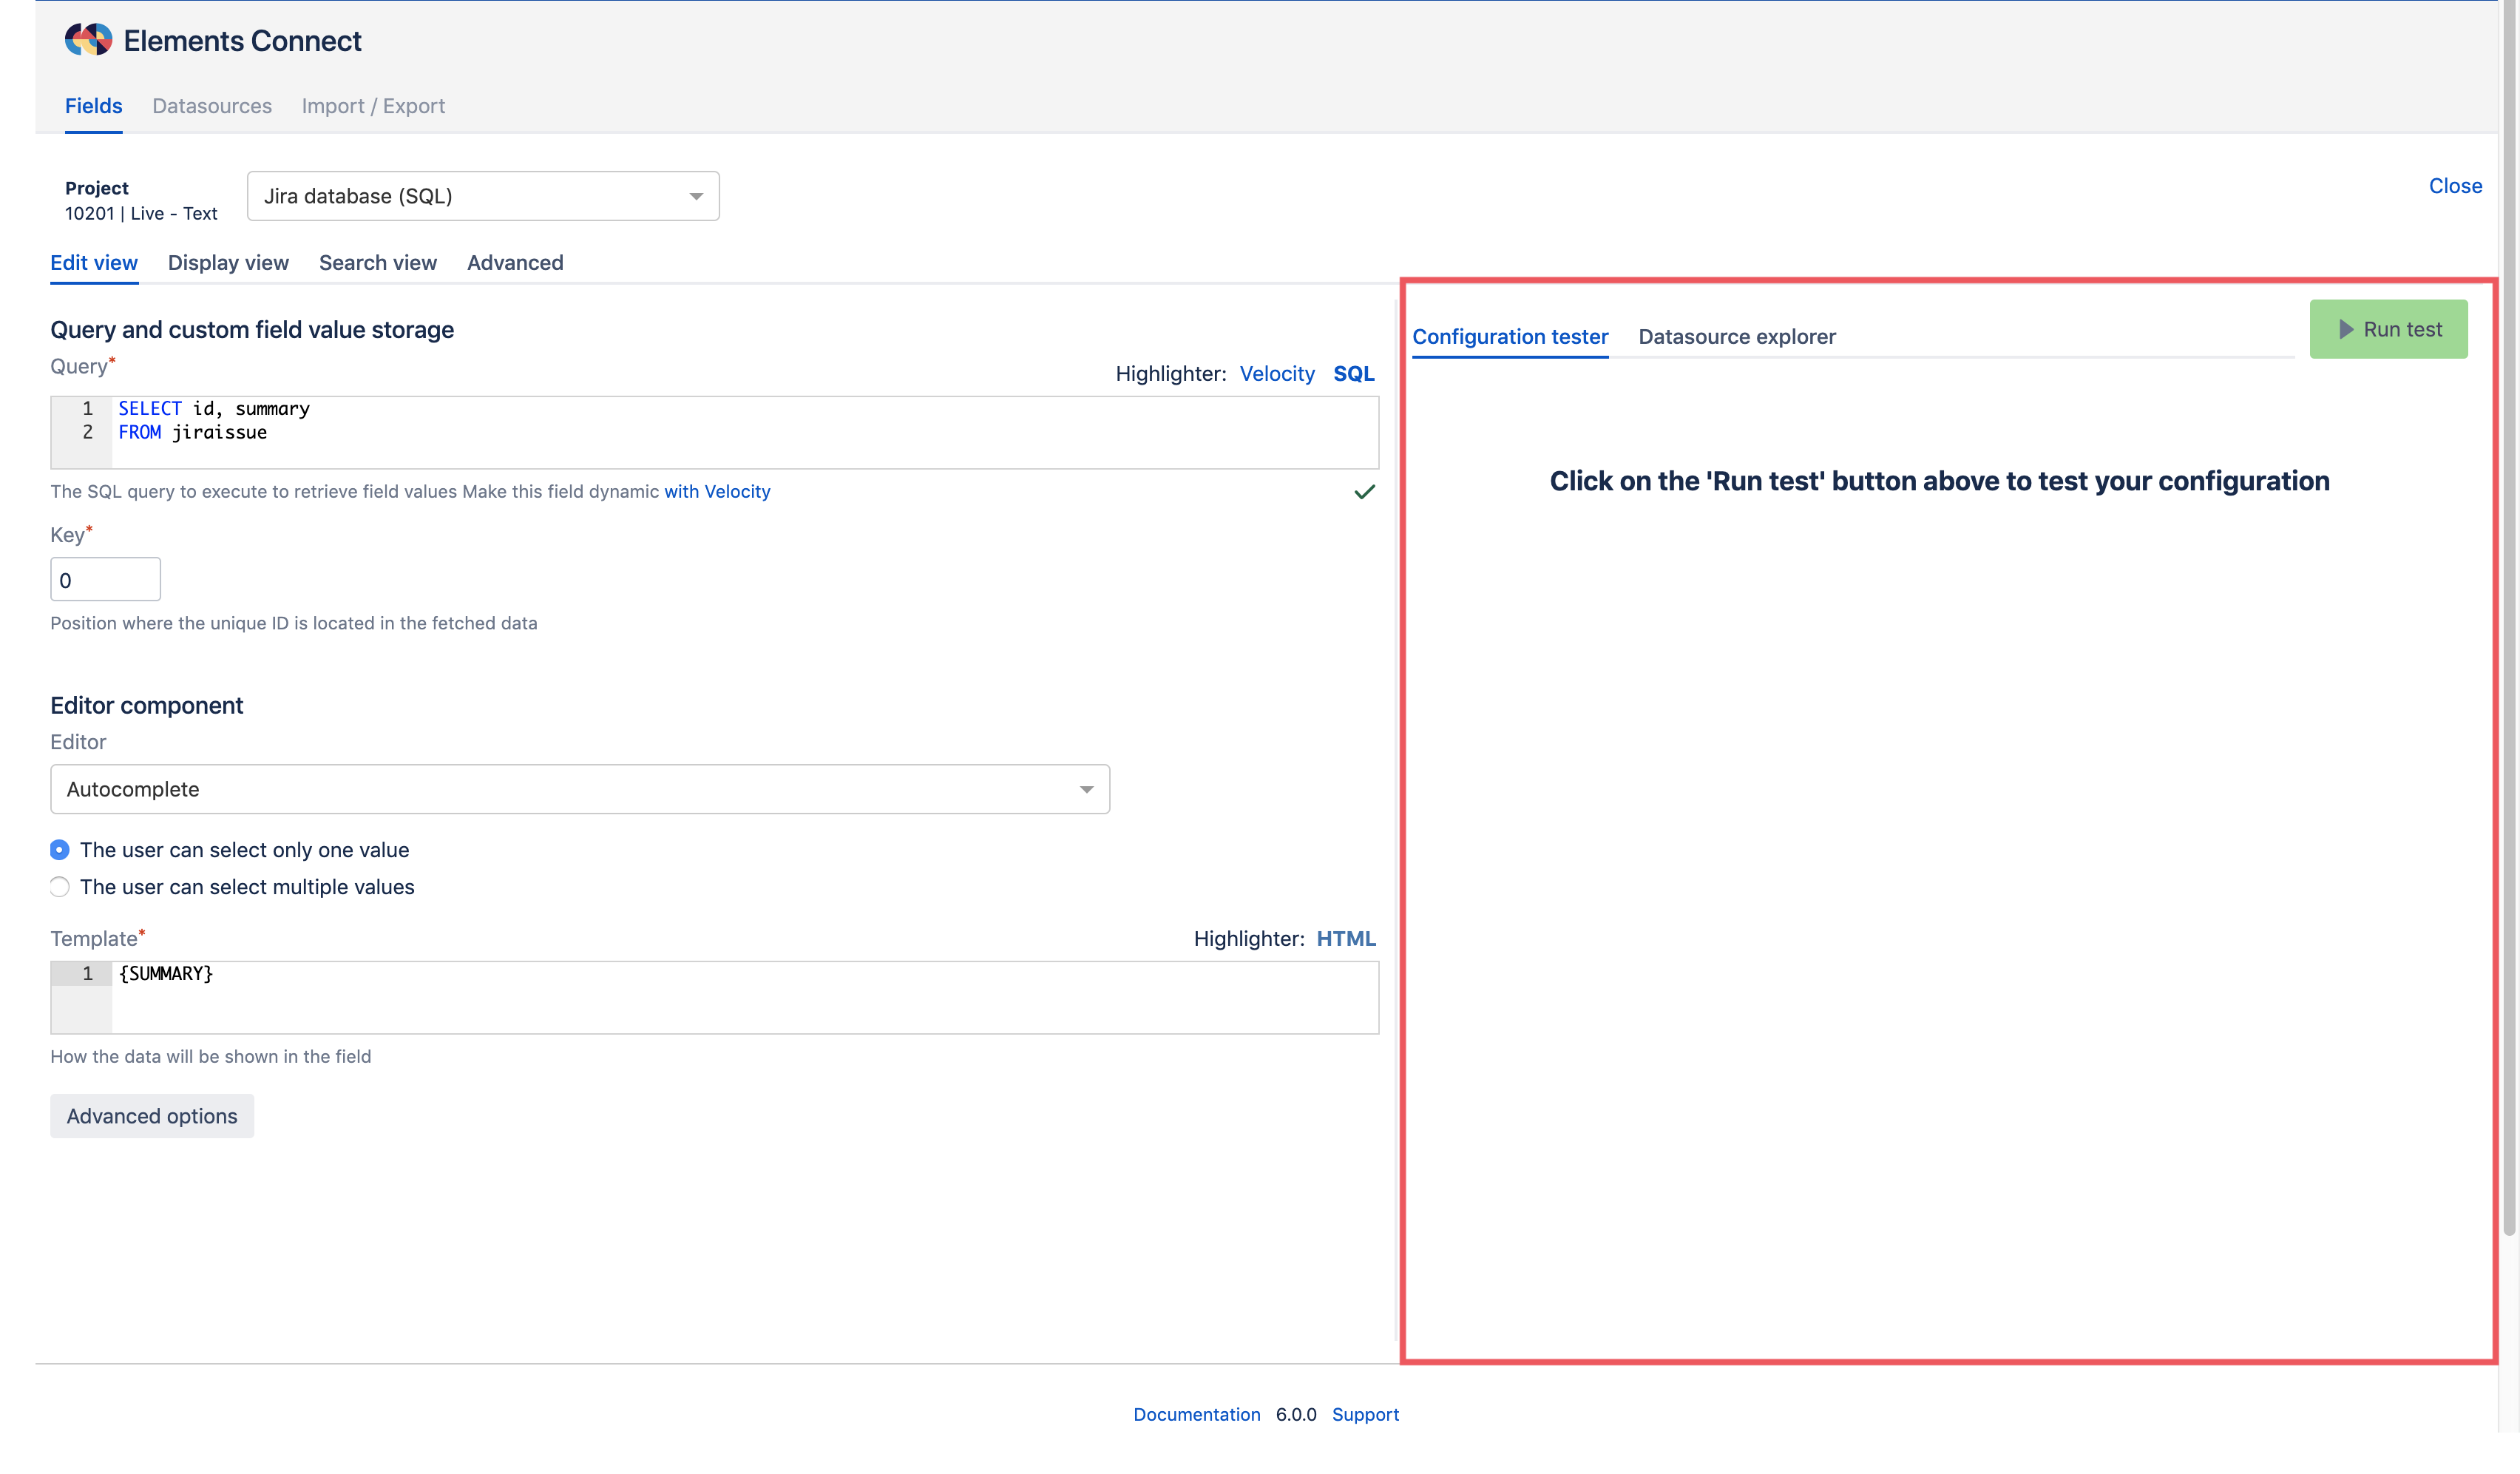
You can use the Configuration tester to test an Elements Connect field configuration when you configure it.
It contains 3 or 5 sections, depending on the datasource type:
- Results
- Transformed JSON / XML (JSON and XML datasources only)
- Table result (JSON and XML datasources only)
- Preview
- Metrics
To launch the configuration tester:
- click on the green Run test button
- or use the keyboard shortcut: CTRL + Enter on a PC, Command + Enter on a Mac.
If the query contains a dependency to $issue, you'll have to select an issue before running the Configuration Tester.
An issue is required to set the query context so that the dependencies can be evaluated
The query tester is executed on the view selected in the field configuration.
Results
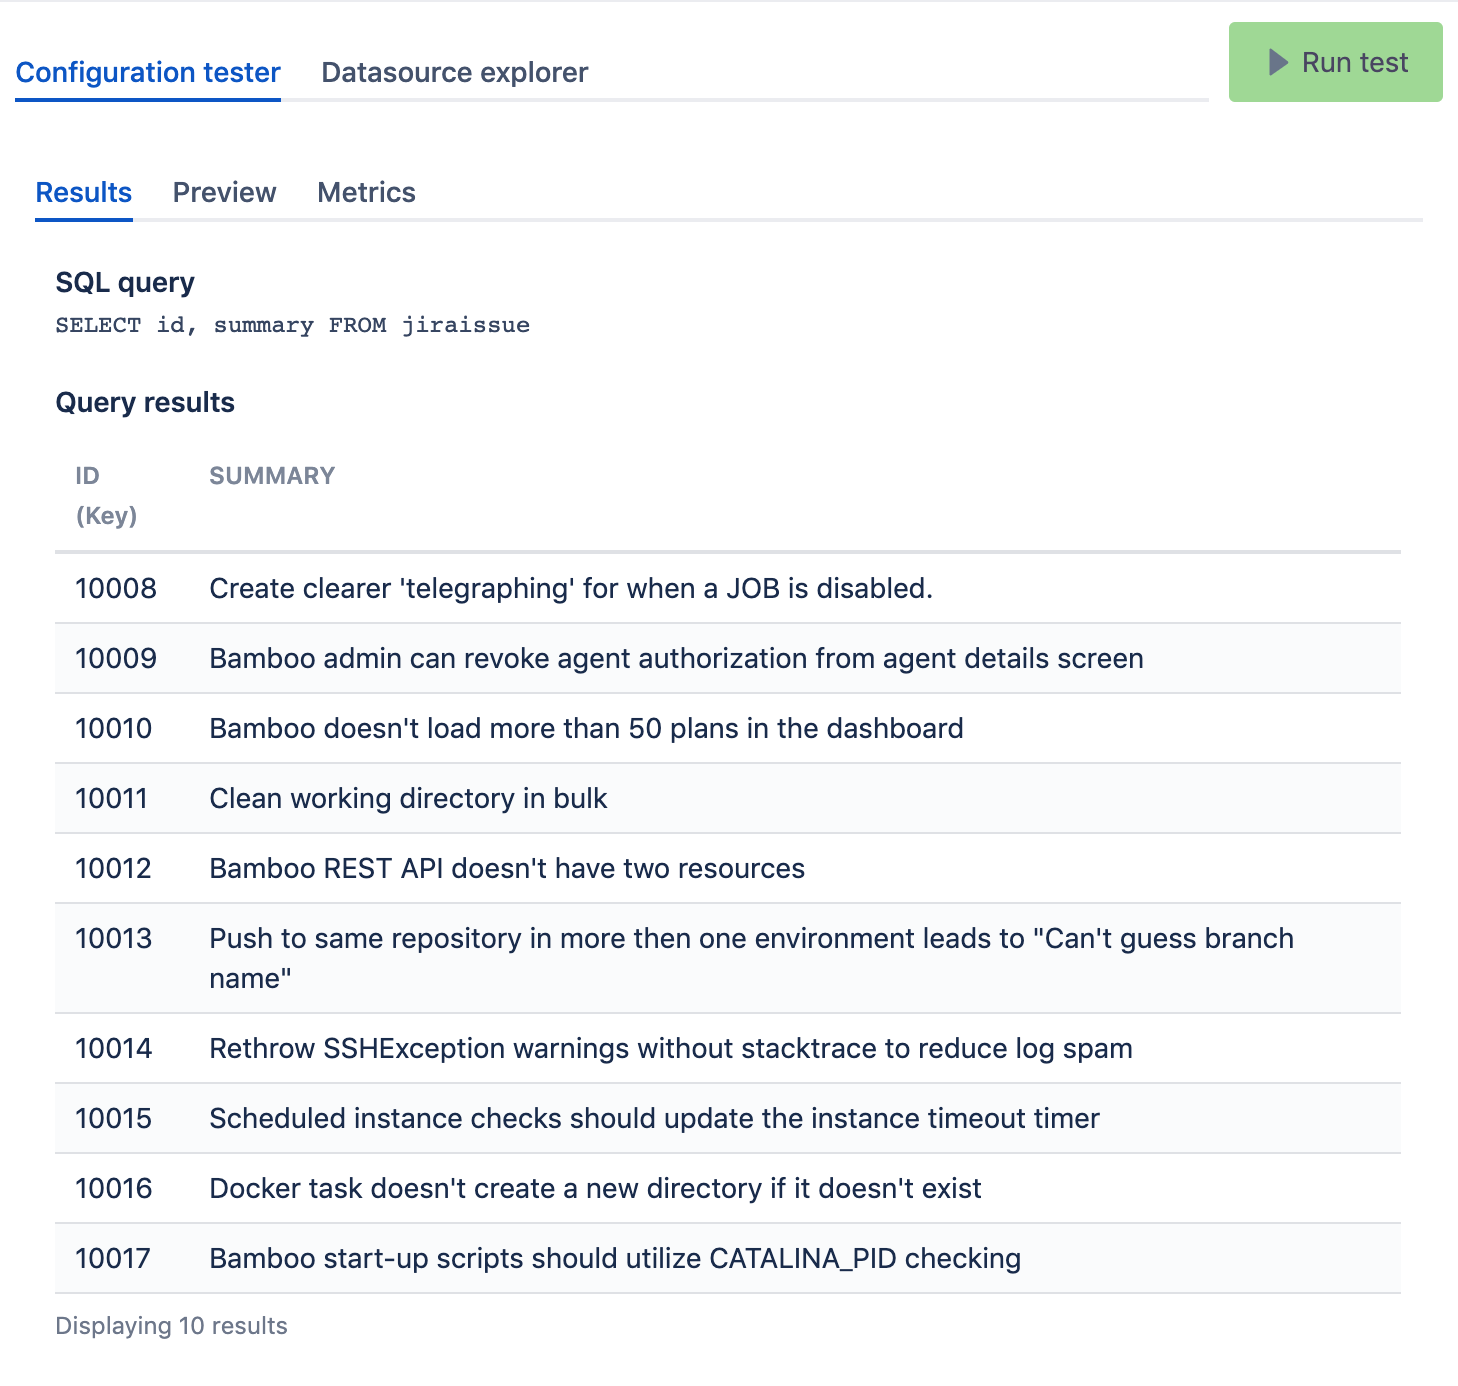
This section displays the query after Velocity evaluation and the raw result as returned by the datasource.
For JQL, SQL, LDAP and CSV datasources, results are displayed in a table:
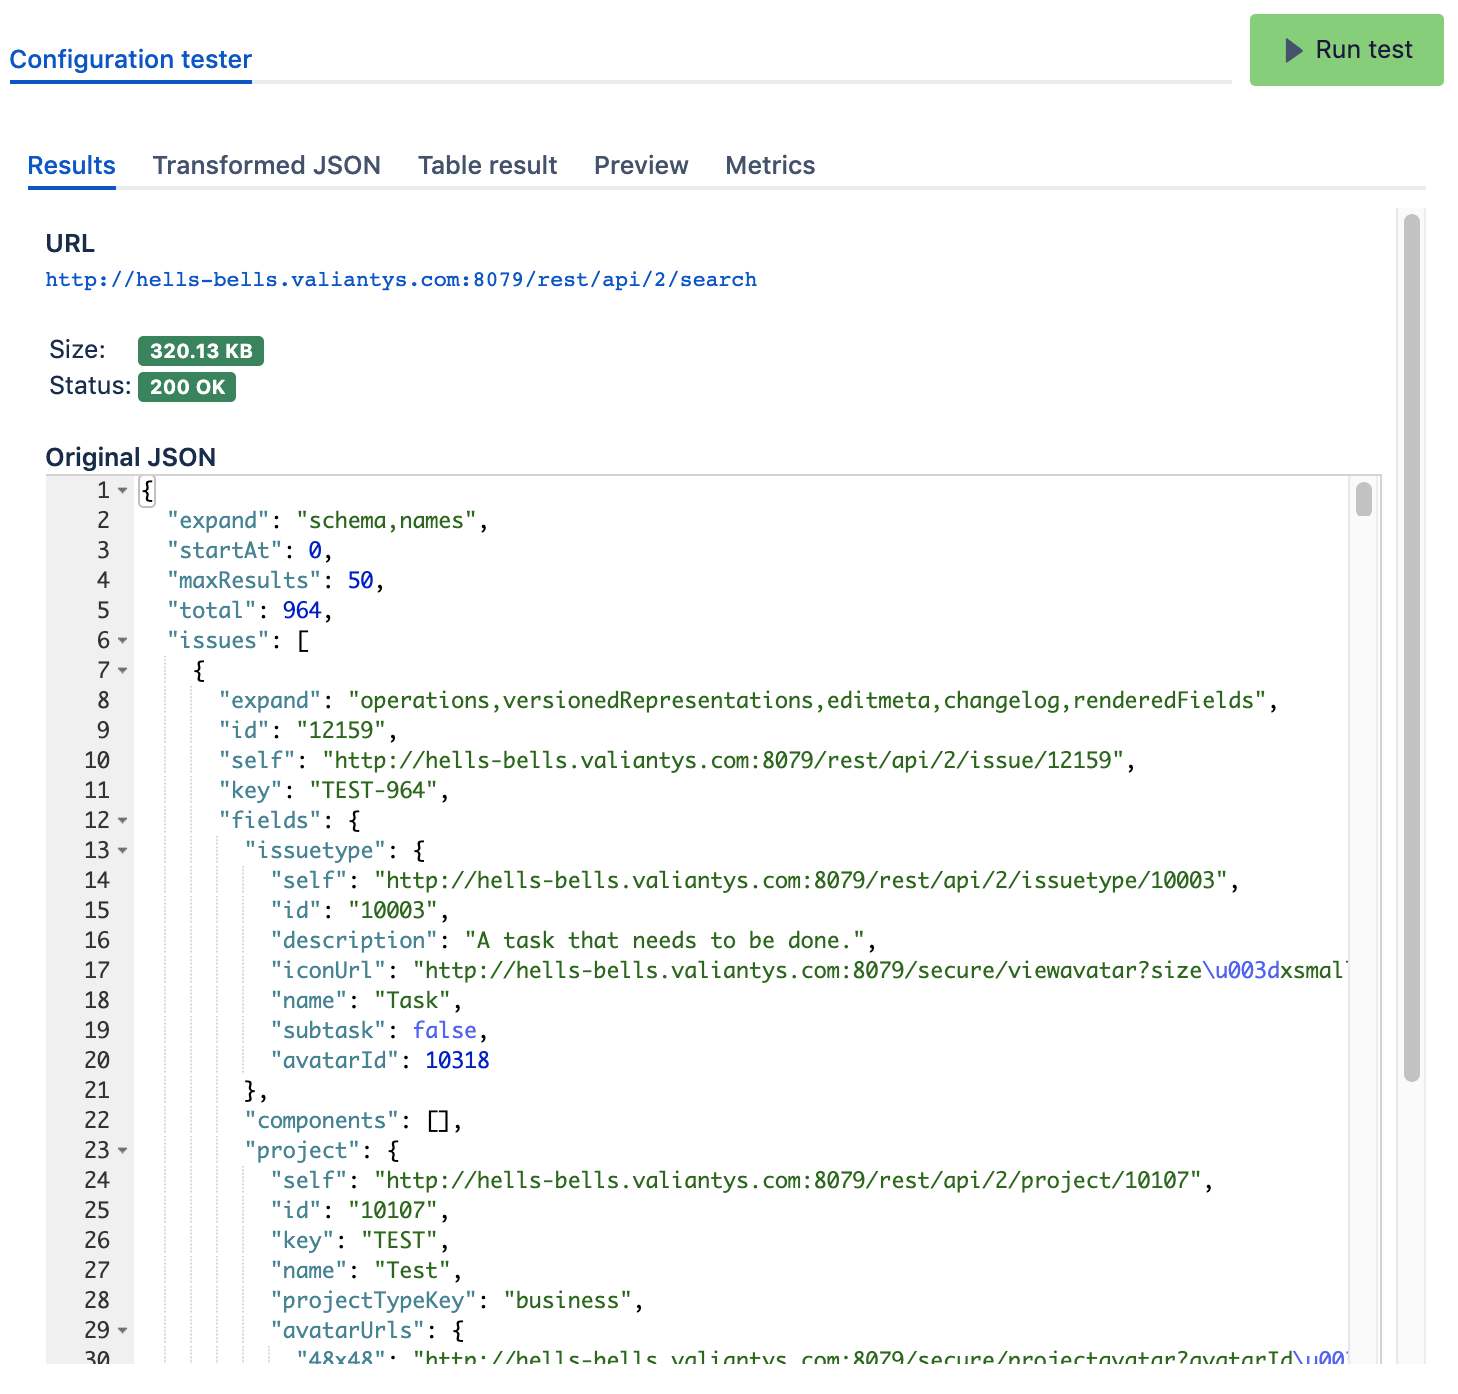
When getting a CSV or JSON file (wether using a File or URL datasource), this tab displays:
- the query URL
- the file size
- the HTTP status - in case of a URL datasource
- the raw file
Transformed JSON / XML
This section is only available when connected to a JSON or XML datasource.
It shows the result of the first transformation:
- output of the XPath evaluation on the raw XML document
- or output of the Root element evaluation on the raw JSON document
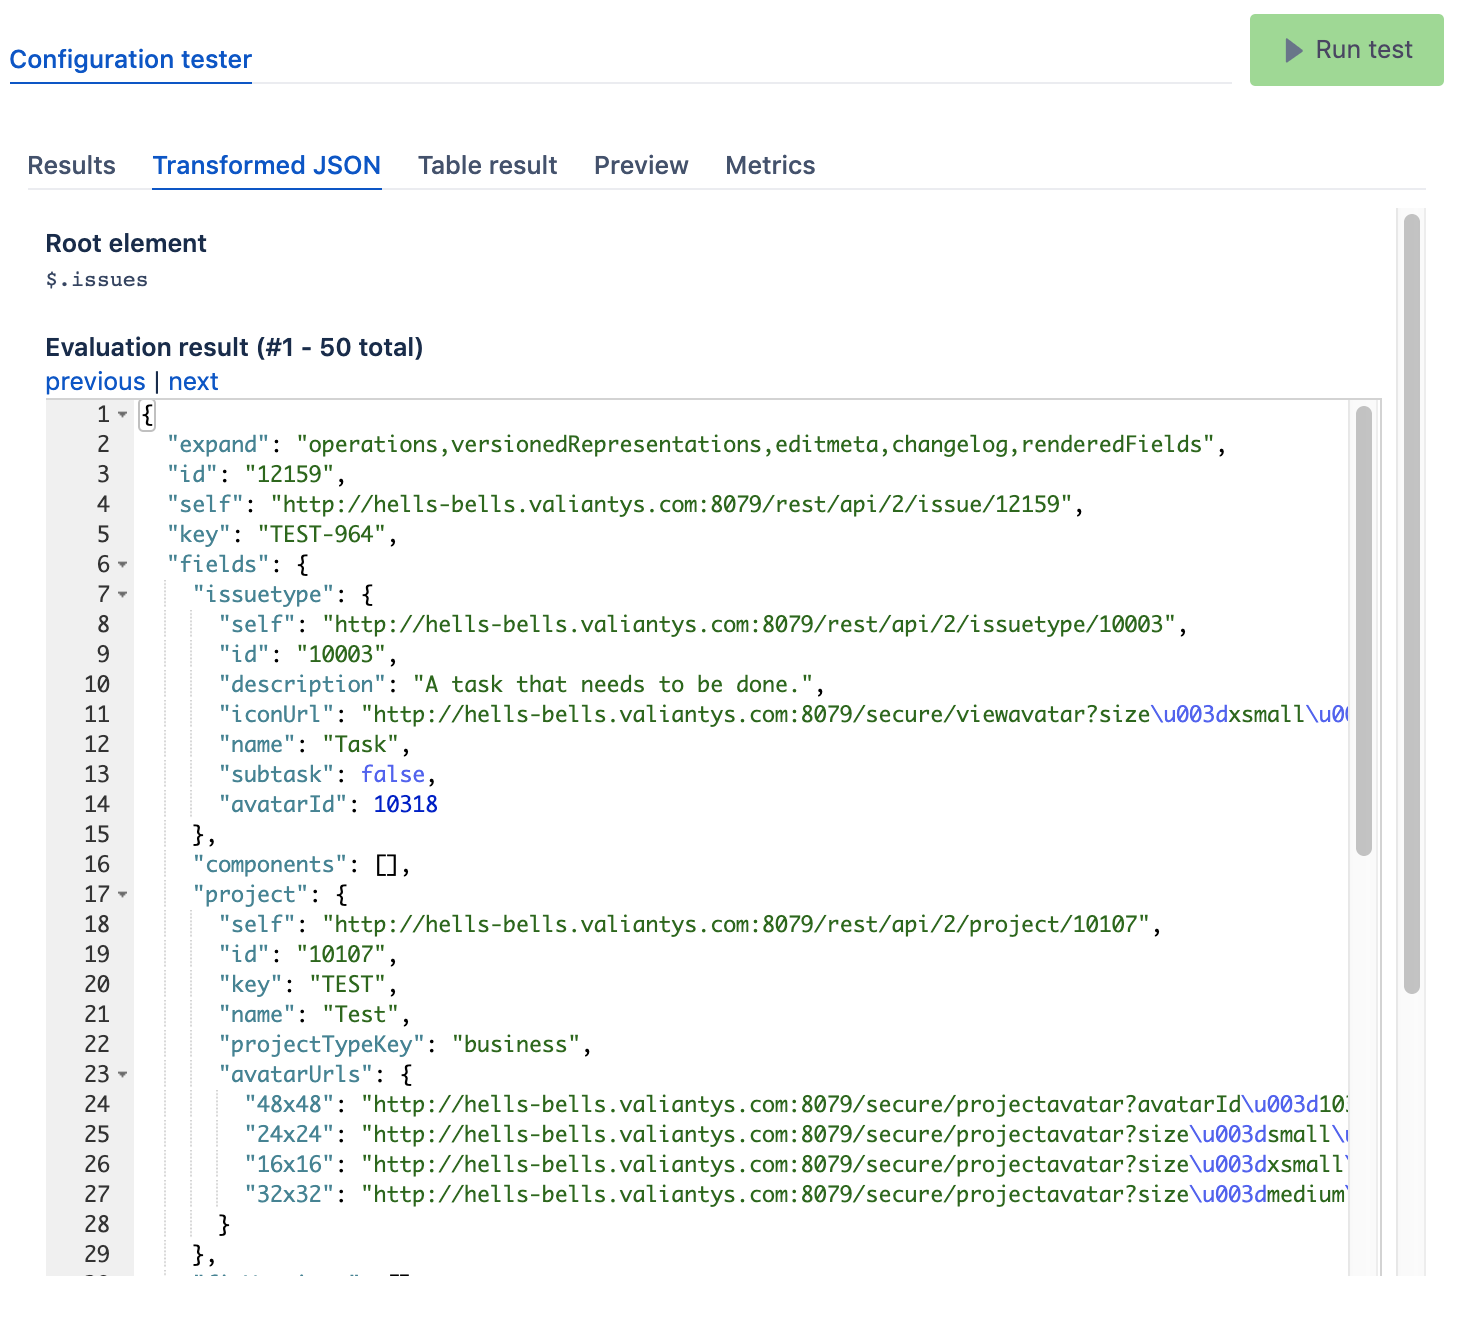
Each document is then sent to the second transformation step to feed the result table.
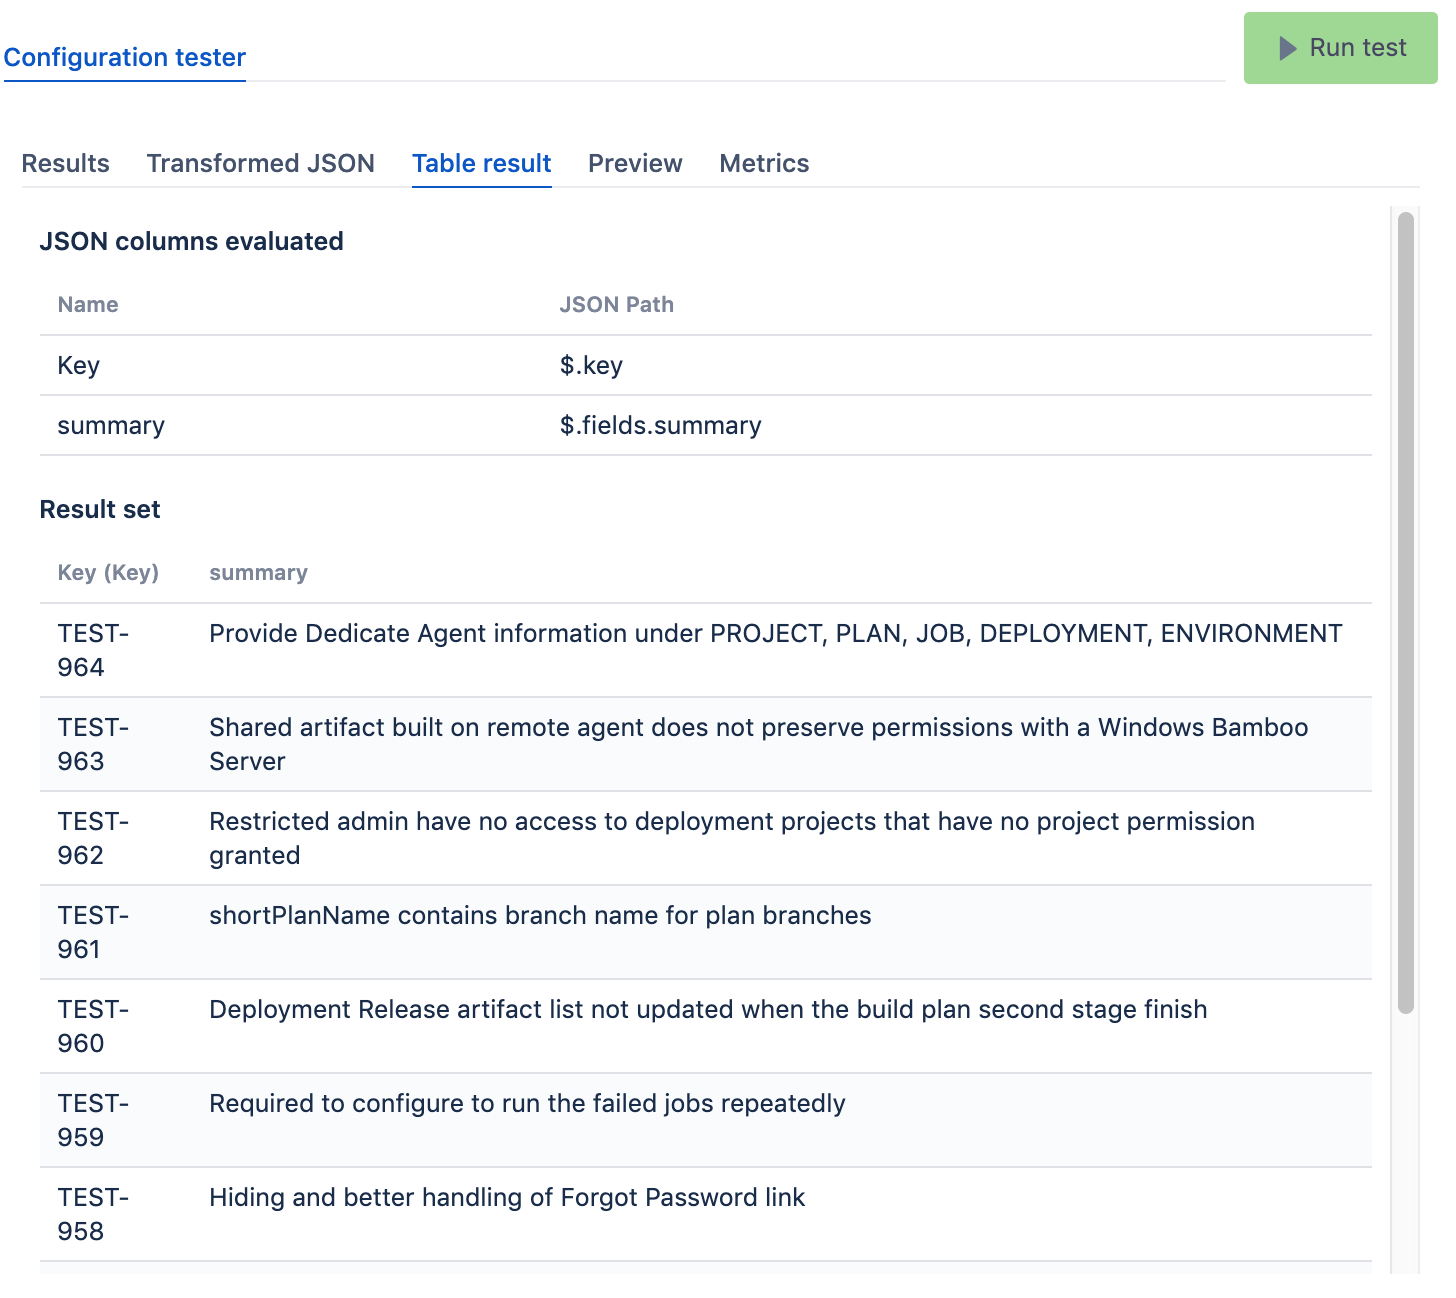
Table result
This section is only available when connected to a JSON or XML datasource.
It shows the result of the second transformation applied on the result of the first transformation (previous step).
Preview
You can see here a preview of the field values as they will be displayed to the Jira users in the field editor:
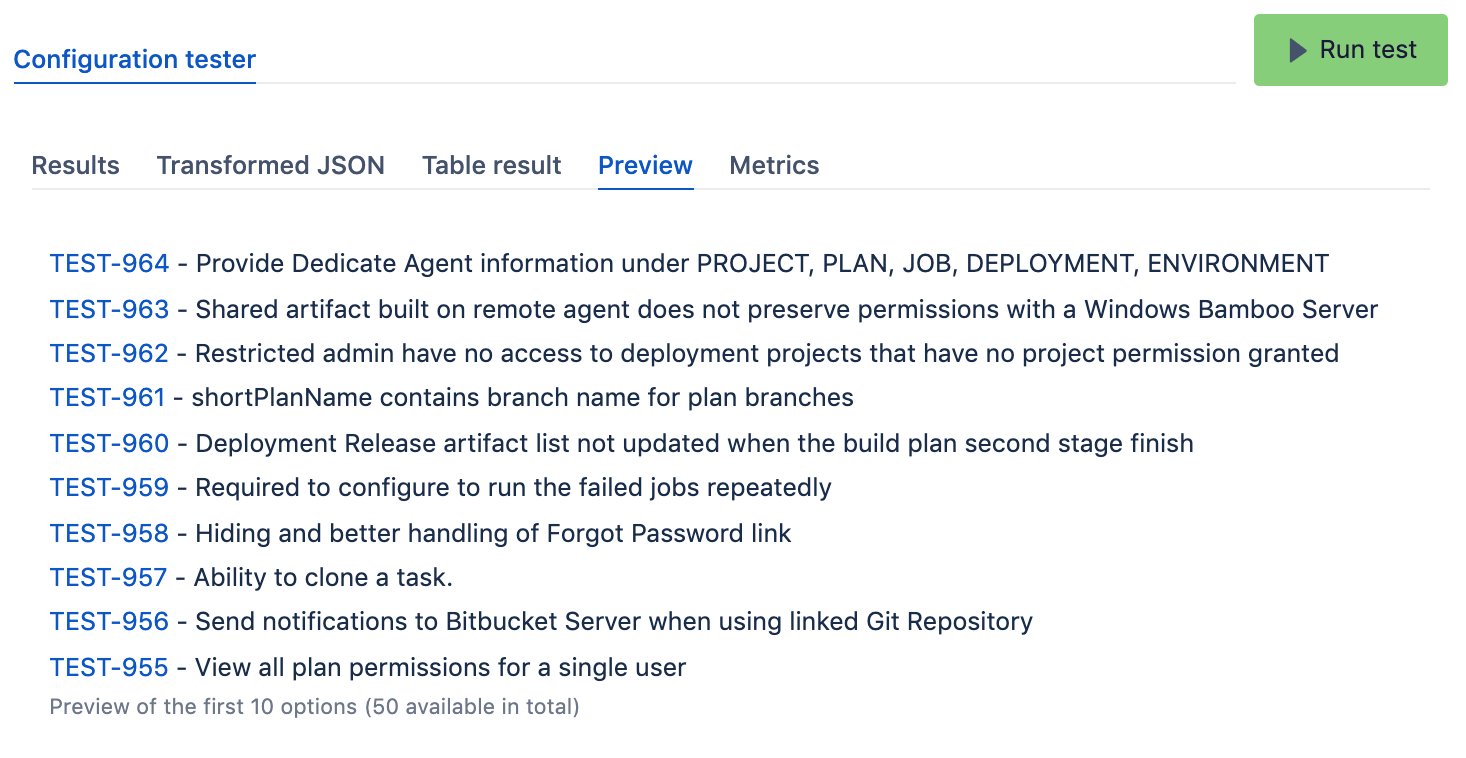
It shows up to 10 results preview.
Metrics
In order to prevent potential slowdowns of your Jira instance due to slow queries, you can see the execution time of the previous test in this section.
The execution time is coloured according to the response time:
- GREEN : between 0 and 500 ms
- YELLOW : between 500 and 1500 ms
- RED : higher than 1500 ms
If you observe slow response times, please consider applying our performances improvement tips.
If you still encounter performances issues after having applied the performance tips, you can reach our support team.
Please do not forget to attach your Elements Connect support dump and the full metrics report to your request.

