Field configuration screen
Main sections
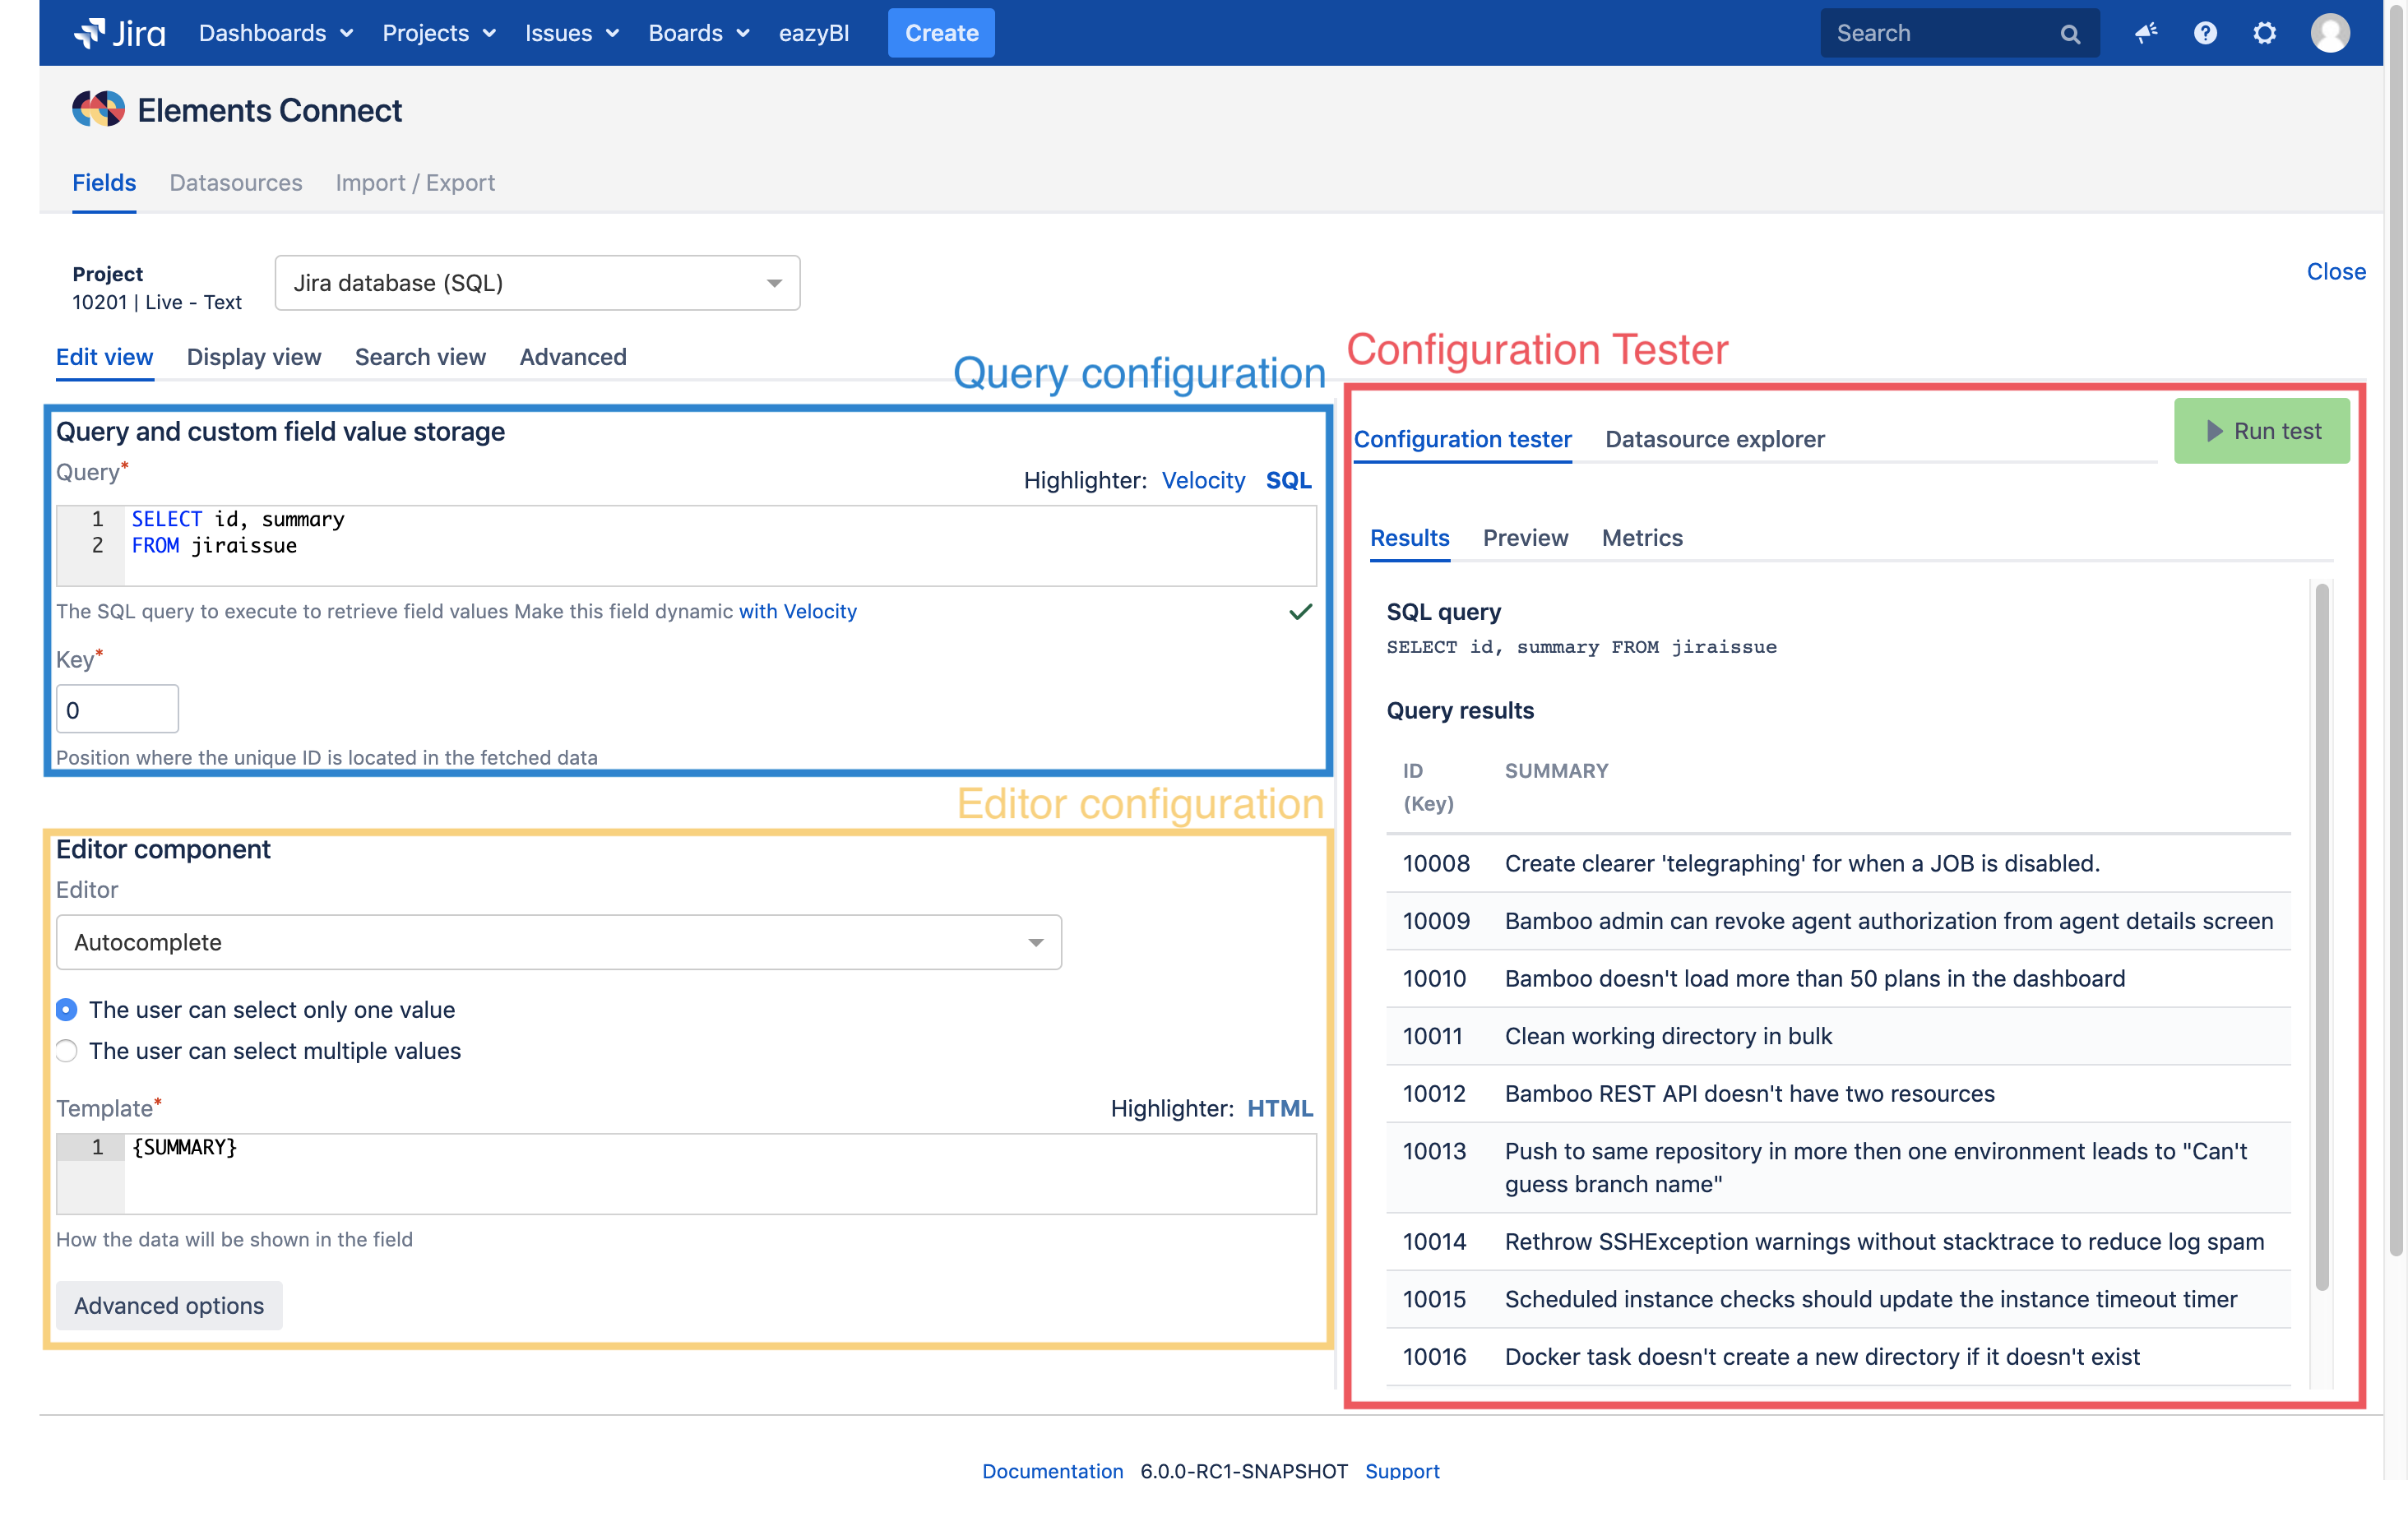
Field configuration screen contains four main sections:
- Edit view
- Display view
- Search view
- Advanced
Edit / Display / Search sections are basically the same, this is where we configure how the field should behave in different location of Jira.
You'll find more information about the Edit / Display / Search views in the different views page.
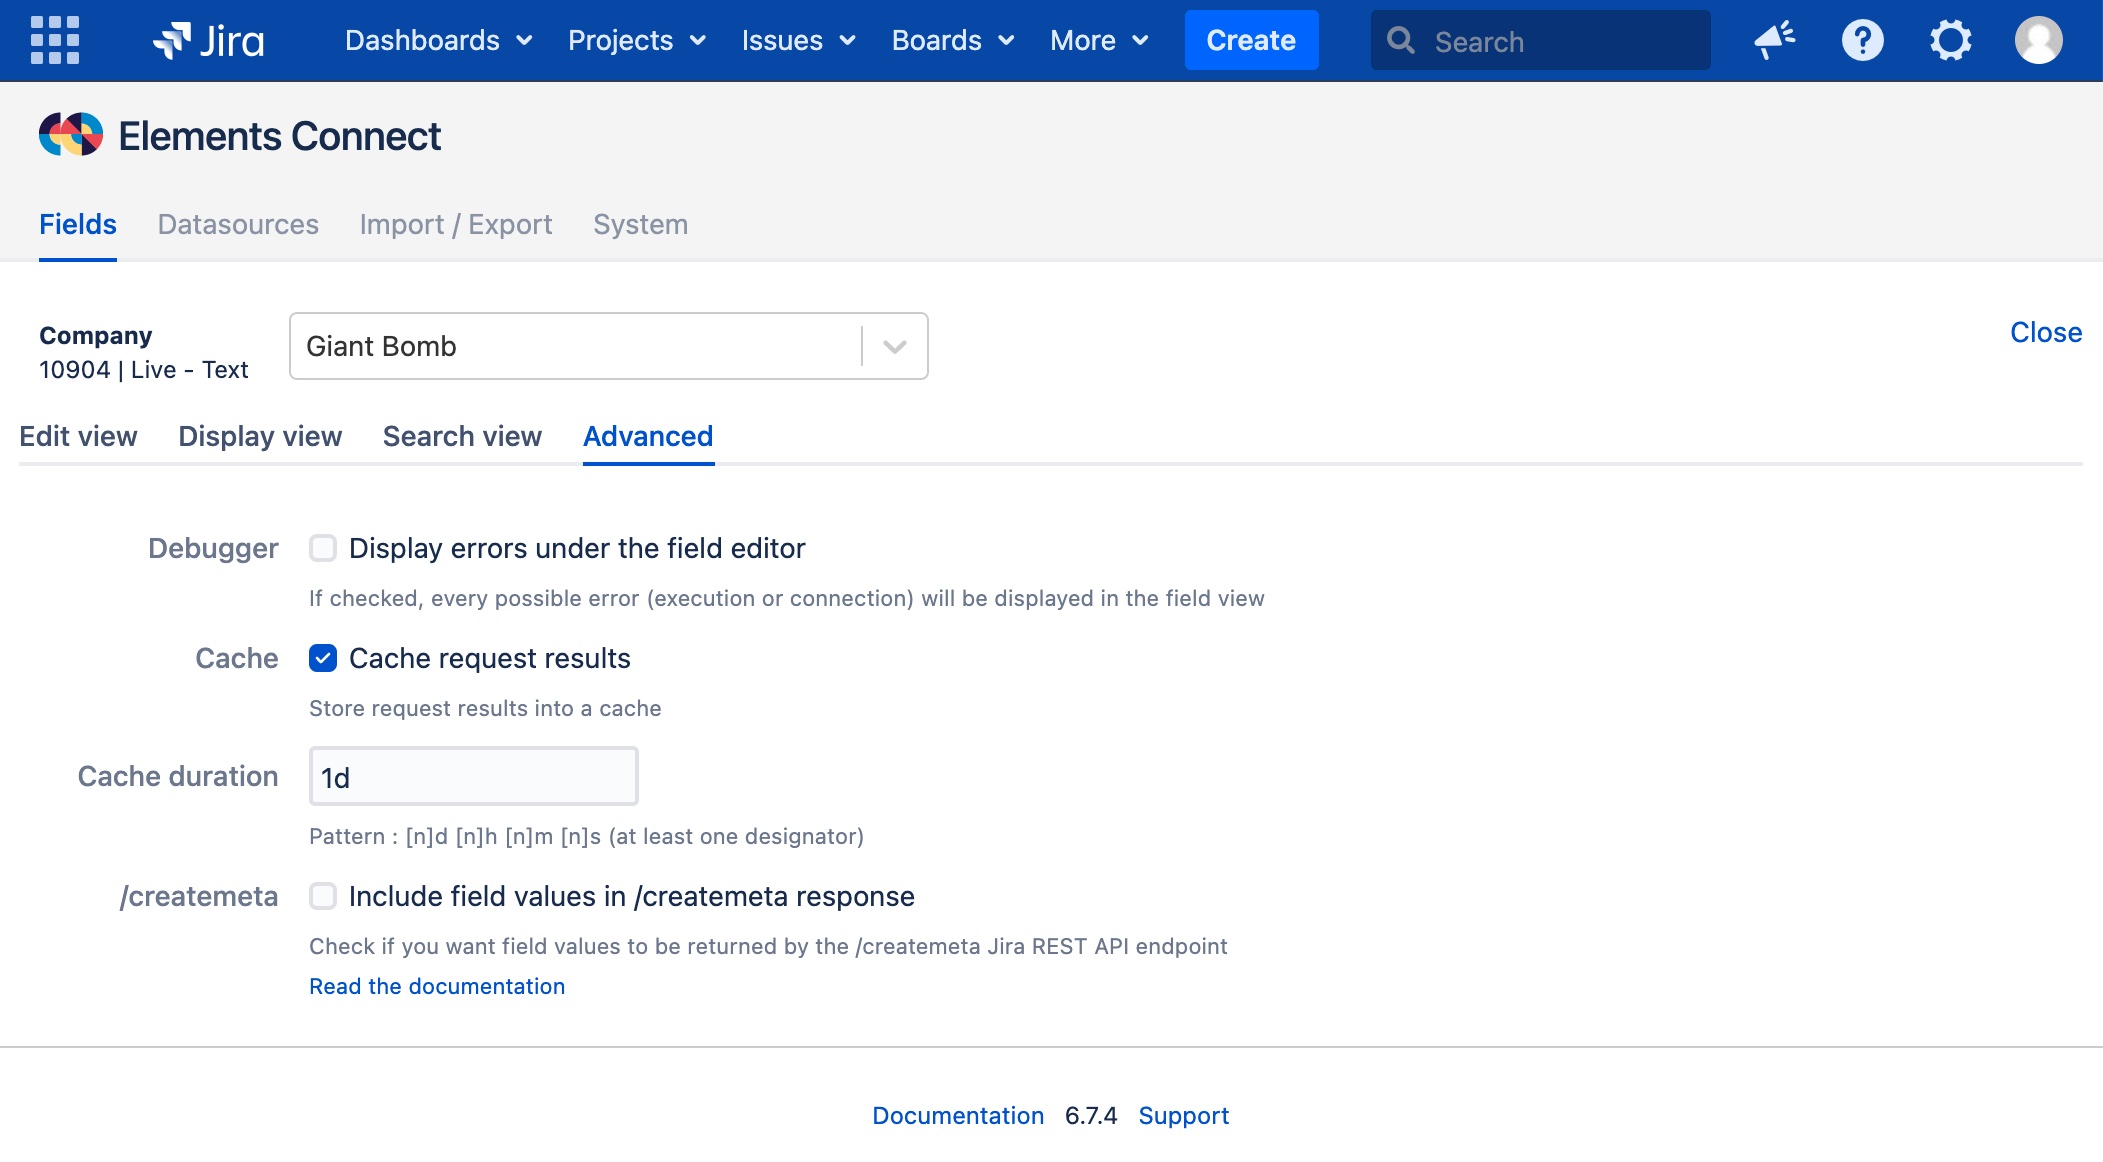
The Advanced section is used to set debugging and cache configuration.
You'll find more information about the Advanced configuration in Field configuration screen#Advanced section of this page.
Sub sections
The sections are divided into three sub-sections:
- Query configuration
- Editor configuration
- Configuration tester

Query configuration
To tell Elements Connect how it shall get values from the datasource, you first have to configure the query.
Depending on your datasource, you'll have to use different query language.
For example, SQL to get data from a database or LDAP query to get data from a User Directory.
Whatever the datasource type is, the result of the query is a table that is then used to generate the template.
An example of table result:
| CustomerID | CustomerName | CustomerCountry |
|---|---|---|
| CUS-1 | Globex | USA |
| CUS-2 | World company | UK |
| CUS-3 | AQME | Japan |
You'll find more information about the query configuration in the field query configuration page.
Editor configuration
Then, once Elements knows how to get data from the datasource in a table structure, we have to tell him how to display the values in the field editor.
This configuration is done in the "Edit component" section.
You'll find more information about the template configuration in the field editor configuration page.
Configuration tester
In order to help you debug your configuration, you can use the Configuration tester.
With this tool you can see:
- the query as it is evaluated by Connect
- the result of the query execution
- the options formatted as they will be displayed to the user
You'll find more information about the template configuration in the configuration tester page.
Advanced section
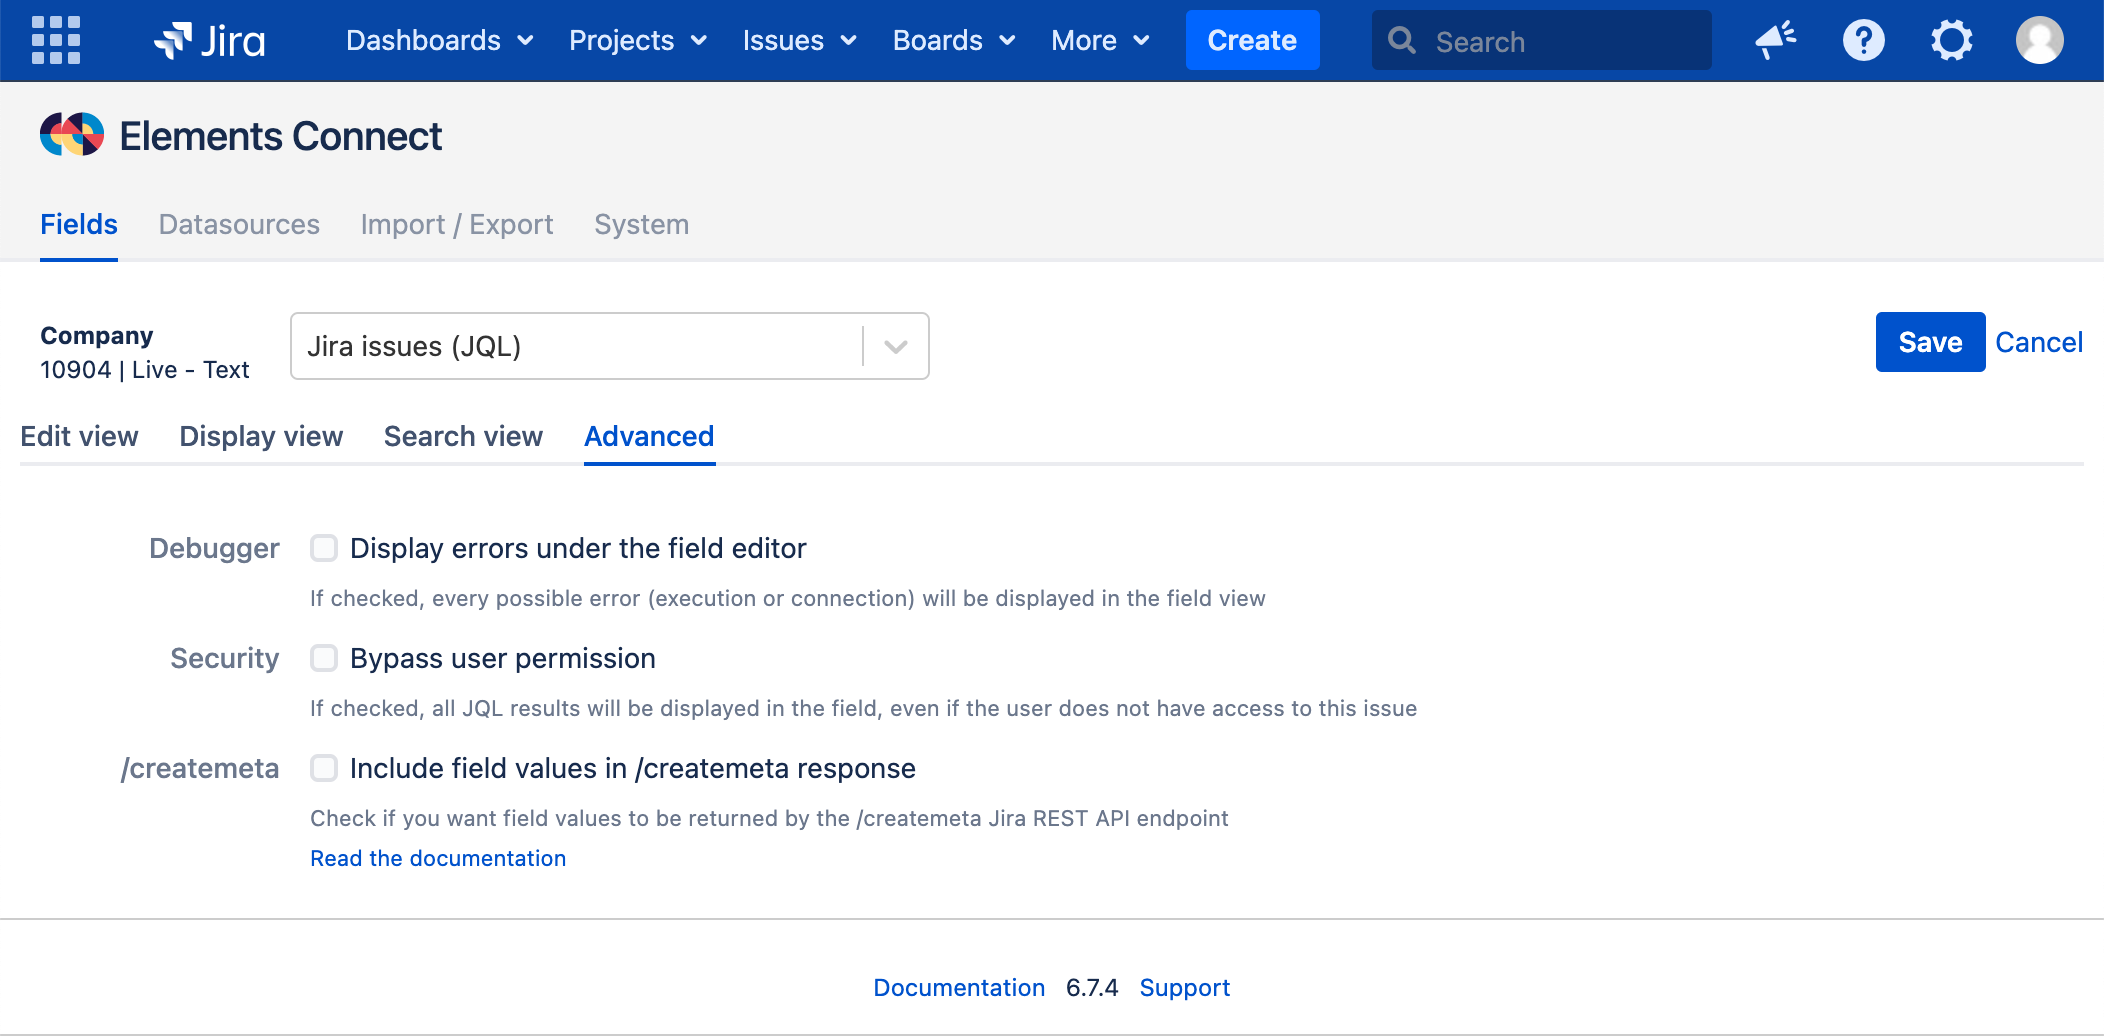
From this tab, you can:
- Activate the debug mode
- Configure the cache
- Activate the /createmeta compatibility
- Activate the "Ignore permissions" mode on the JQL datasources

Advanced tab - Any datasource except JQL

Advanced tab - JQL datasource
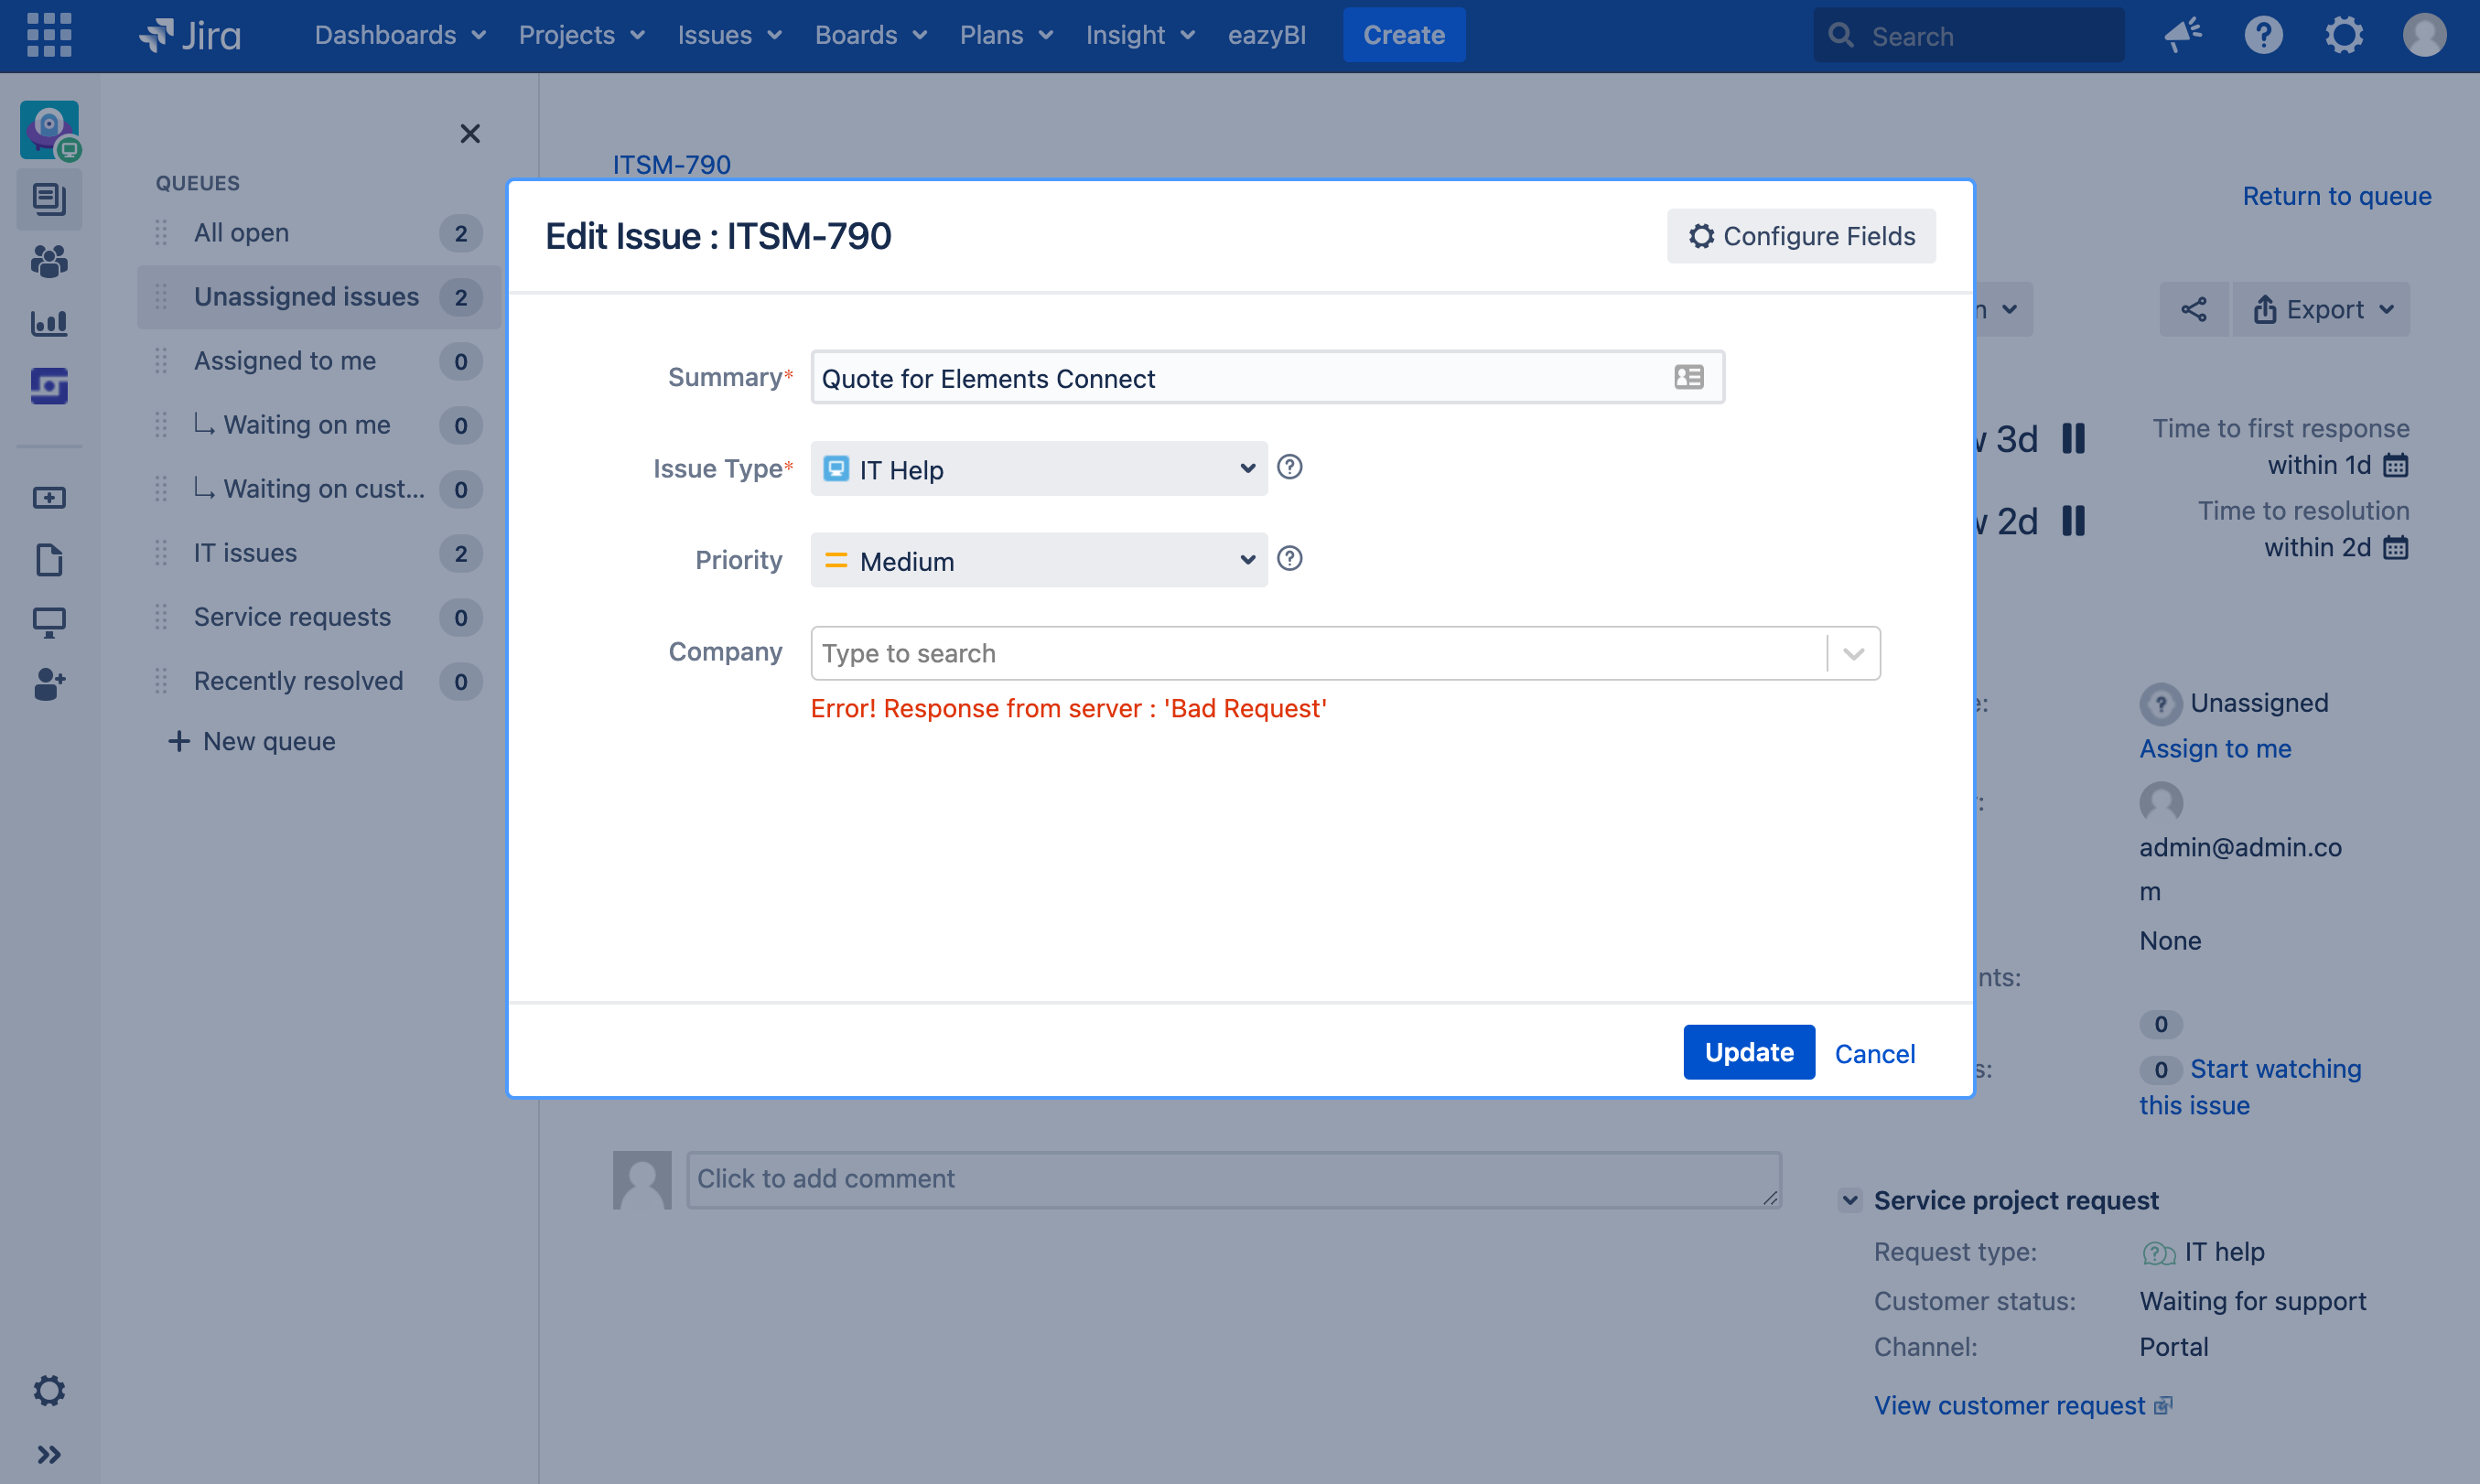
Activate the debug mode

Editing a field when the debug mode is active
Error messages will be visible when editing from any location (JSM portal, issue creation, inline editing, ...) by all users.
By default, this option is disabled.
Activate the cache
NOT AVAILABLE ON JQL DATASOURCES
When this option is active, Elements Connect will cache all requests made to the field datasource for the configured duration.
It's recommended to activate the cache on all your fields.
The cache duration can be defined in days, hours, minutes or seconds, i.e.:
- 10s → 10 seconds
- 5m → 5 minutes
- 12h → 12 hours
- 1d 12h → 1 day and 12 hours (identical to 36h)
By default, this option is active and is set to 10s (10 seconds).
![]() If you want to learn more about Elements Connect cache and performance improvement in general, please read this page: Improve performances
If you want to learn more about Elements Connect cache and performance improvement in general, please read this page: Improve performances
/createmeta compatibility
When this option is active, Elements Connect fields options will be included in the response returned by the /createmeta Jira REST API endpoint.
By default, this option is disabled.
![]() If you want to learn more about the
If you want to learn more about the /createmeta endpoint, read this page: Connect Jira REST API.
Activate the "ignore permissions" mode
JIRA JQL DATASOURCE ONLY
When this option is active, all issues matching the JQL query will be displayed in the field editor, even those not accessible to the current user.
Check this option if you want to:
- allow users select issues they don't have the permission to view
- allow users view issues selected in Elements Connect field they don't have the permission to view
By default, this option is disabled.
