
Once your survey has collected responses, Elements Pulse gives you a dedicated results page per survey, allowing you to review performance at a glance and drill down into individual responses question by question.
Accessing survey results
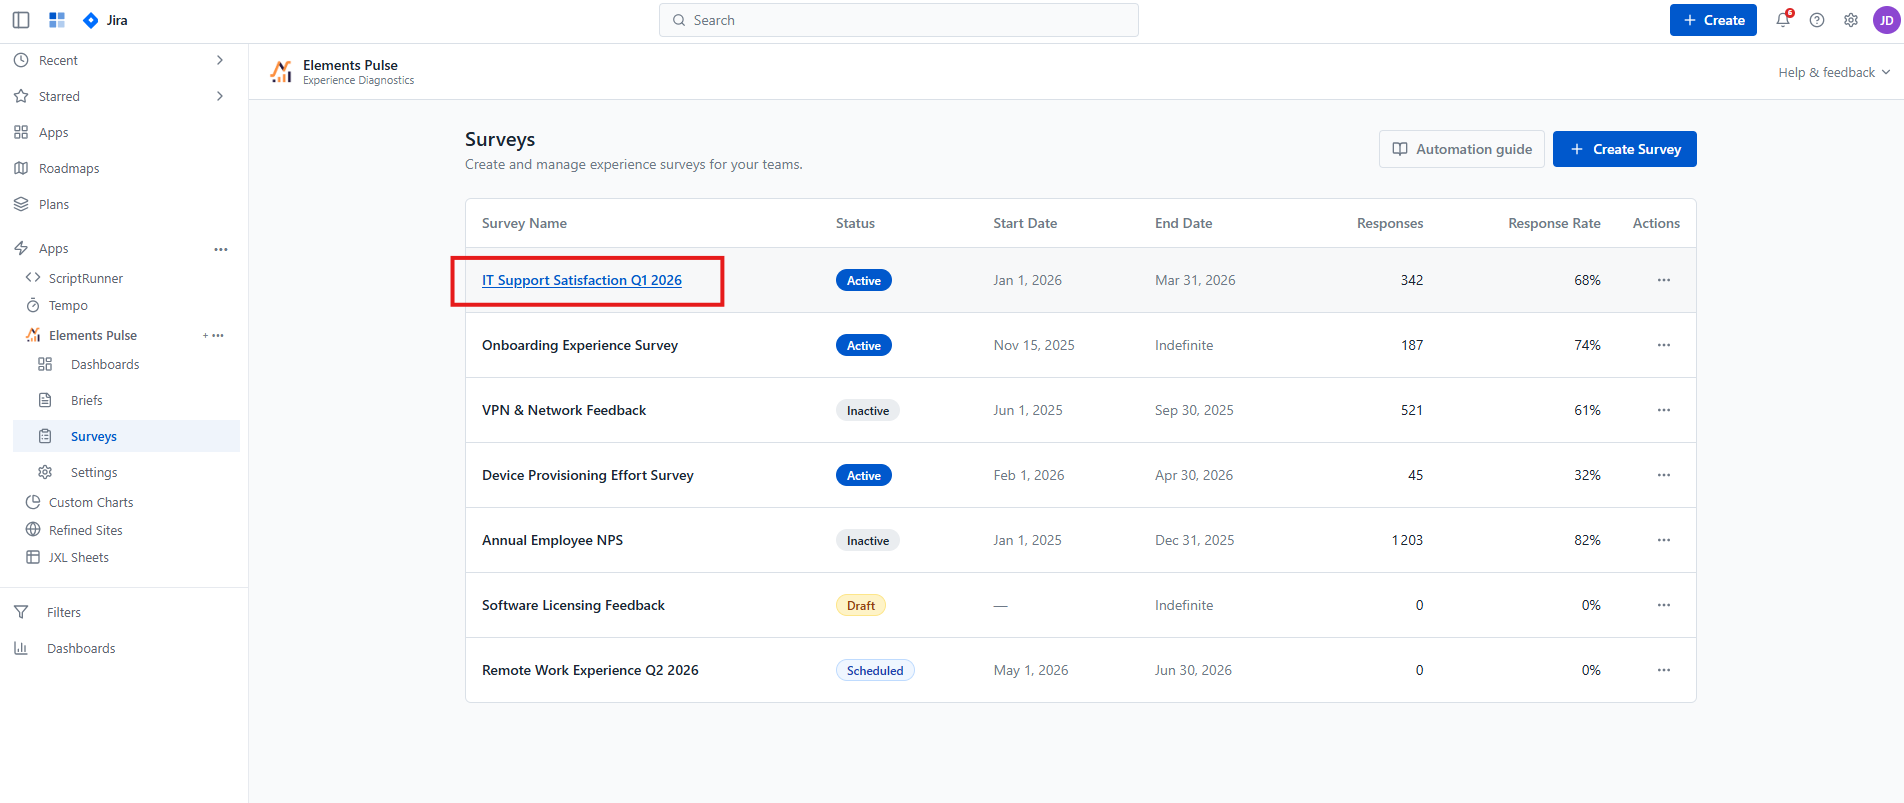
Navigate to Surveys from the Elements Pulse left-hand navigation menu. The survey list gives you an at-a-glance overview of all your surveys, displaying for each:
-
Status — Active, Inactive, Draft, or Scheduled
-
Start and End Date — or Indefinite for open-ended surveys
-
Responses — the total number of responses collected so far
-
Response Rate — the percentage of tickets for which a survey response was submitted
Click on any survey name to open its full results page.
Survey results overview
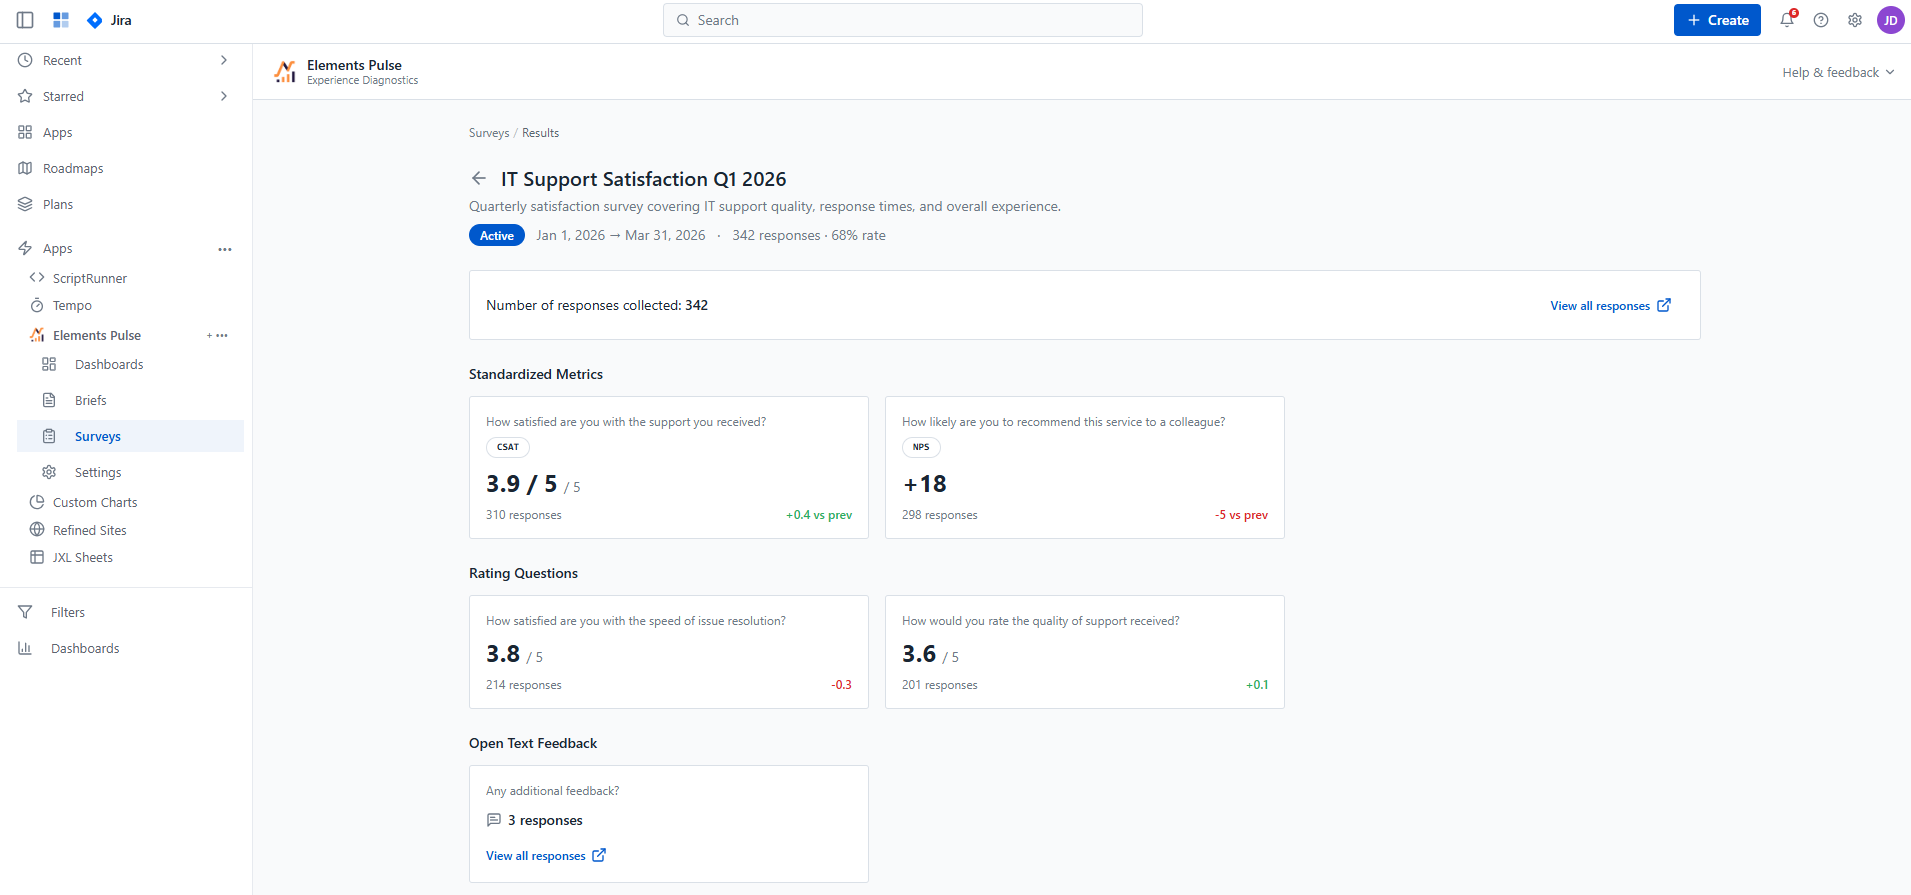
The results page shows a summary header with the survey name, description, status, active date range, total number of responses, and overall response rate.
A banner at the top confirms the total number of responses collected, with a View all responses link to access the full individual response log.
Results are organised into three sections depending on the question types included in the survey:
Standardized Metrics
Cards for each standard metric question (CSAT, NPS, CES) display:
-
The question text
-
The metric type badge
-
The average score (e.g. 3.9 / 5 for CSAT, +18 for NPS)
-
The total number of responses for that question
-
A trend vs the previous period (e.g. +0.4 vs prev)
Rating Questions
Cards for custom rating and scale questions follow the same format — average score, response count, and trend — allowing you to compare performance across your custom indicators alongside the standard metrics.
Open Text Feedback
Cards for open-text questions show the number of responses collected and a View all responses link to read individual written answers.
Drilling down into a question
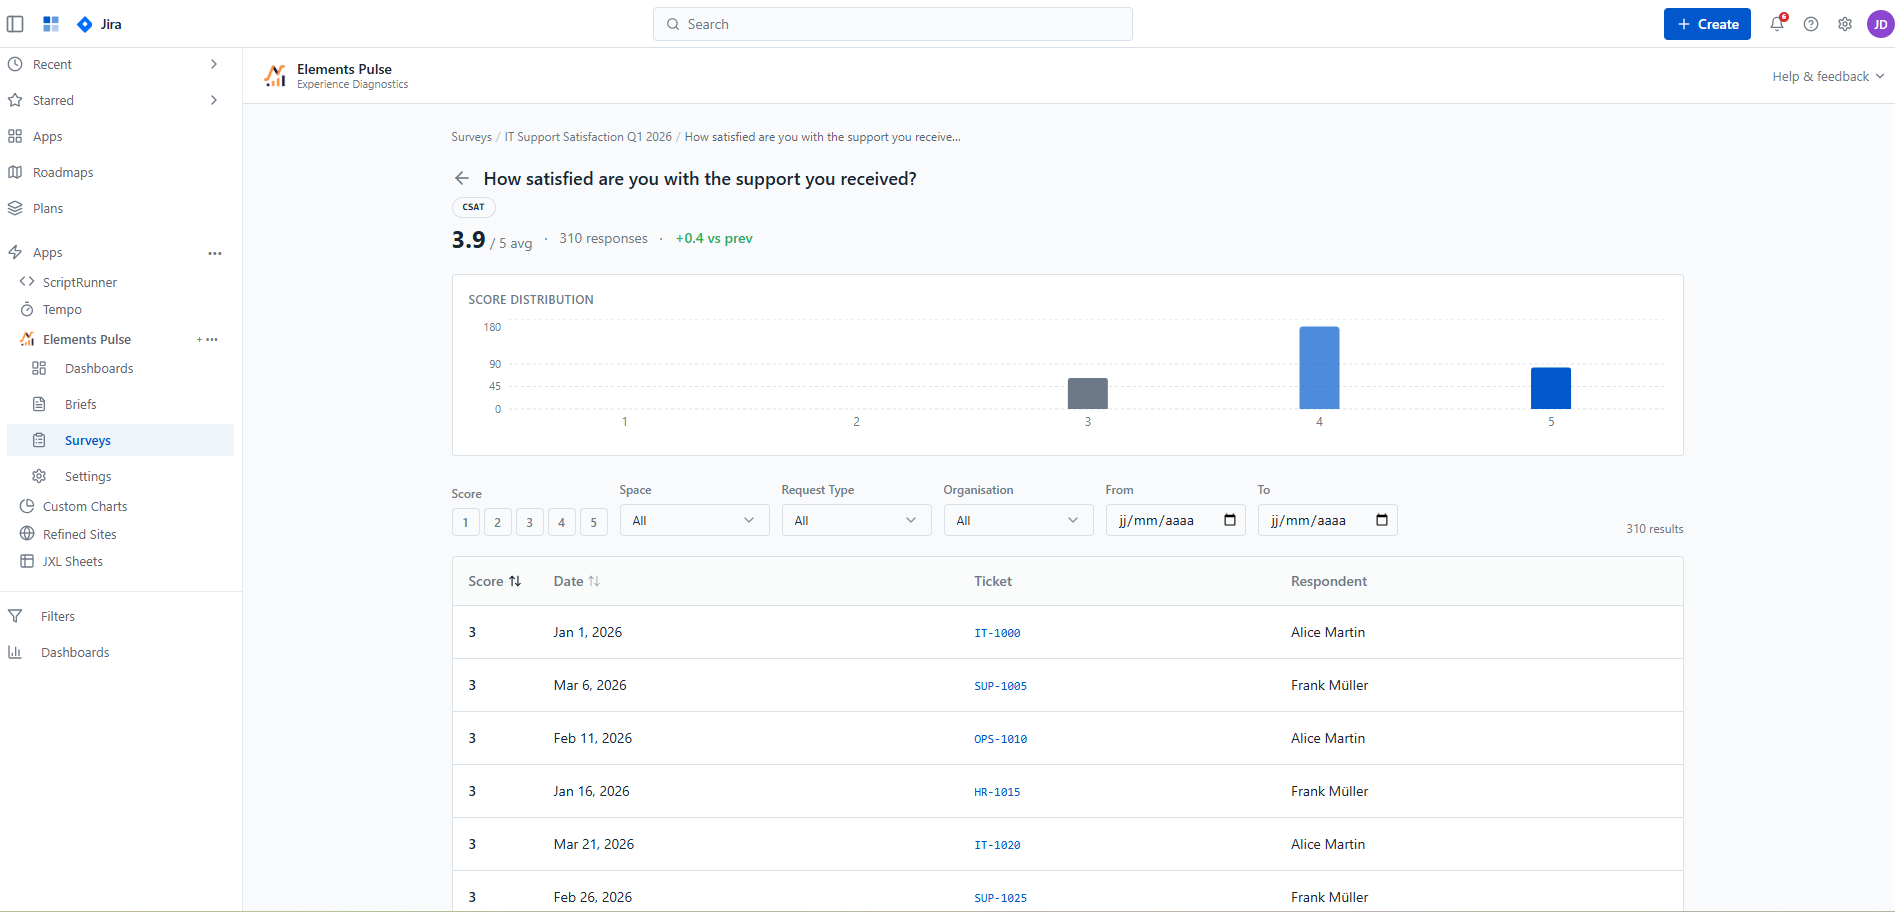
Clicking any question card opens a dedicated drill-down page for that question, giving you a deeper view of the responses.
For standard metrics and rating questions, the drill-down page shows:
-
The question text, metric type, average score, response count, and trend in the header
-
A Score Distribution bar chart showing how responses are spread across the scale (e.g. how many employees gave a 1, 2, 3, 4, or 5)
-
A filterable response table with columns for Score, Date, Ticket, and Respondent — filterable by score value, Organisation, Space, Request Type, and date range
For open-text questions, the drill-down page shows:
-
A Response Distribution chart plotting response volume over time, toggleable by Quarter, Month, or Week
-
A filterable response table listing each individual written answer alongside the linked ticket, date, and respondent — filterable by Space, Request Type, Organisation, and date range
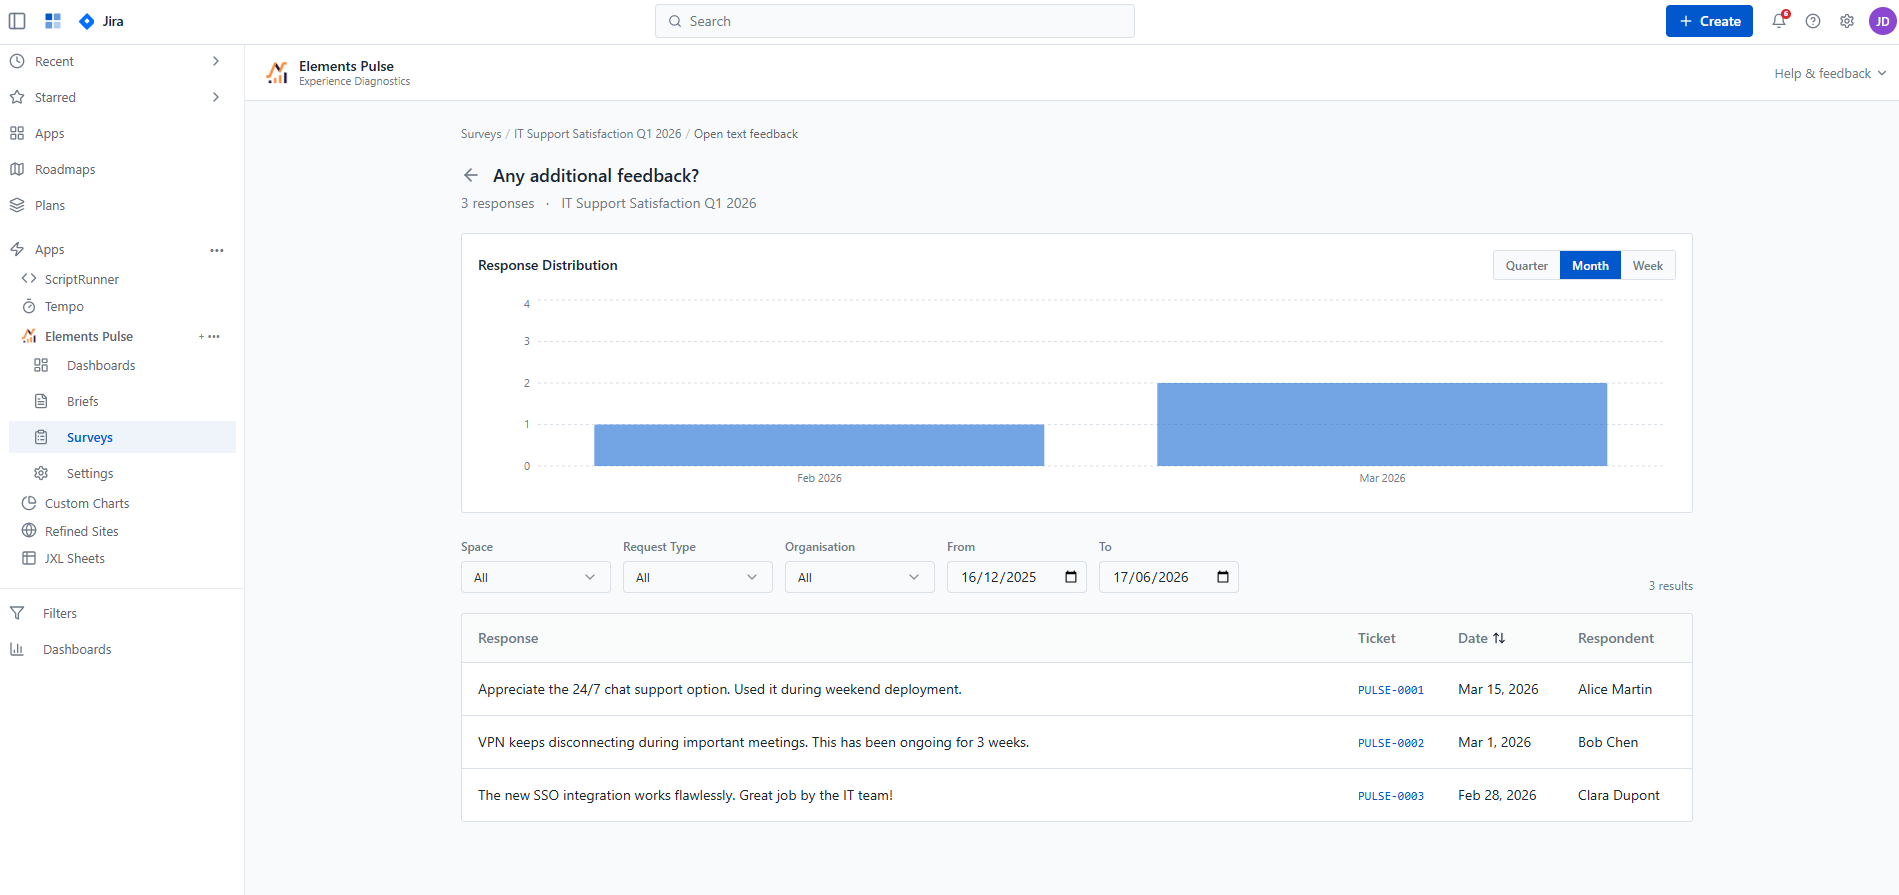
In both cases, ticket references are clickable and link directly back to the originating JSM work item, giving you full context for any individual response.
Viewing all responses for a survey
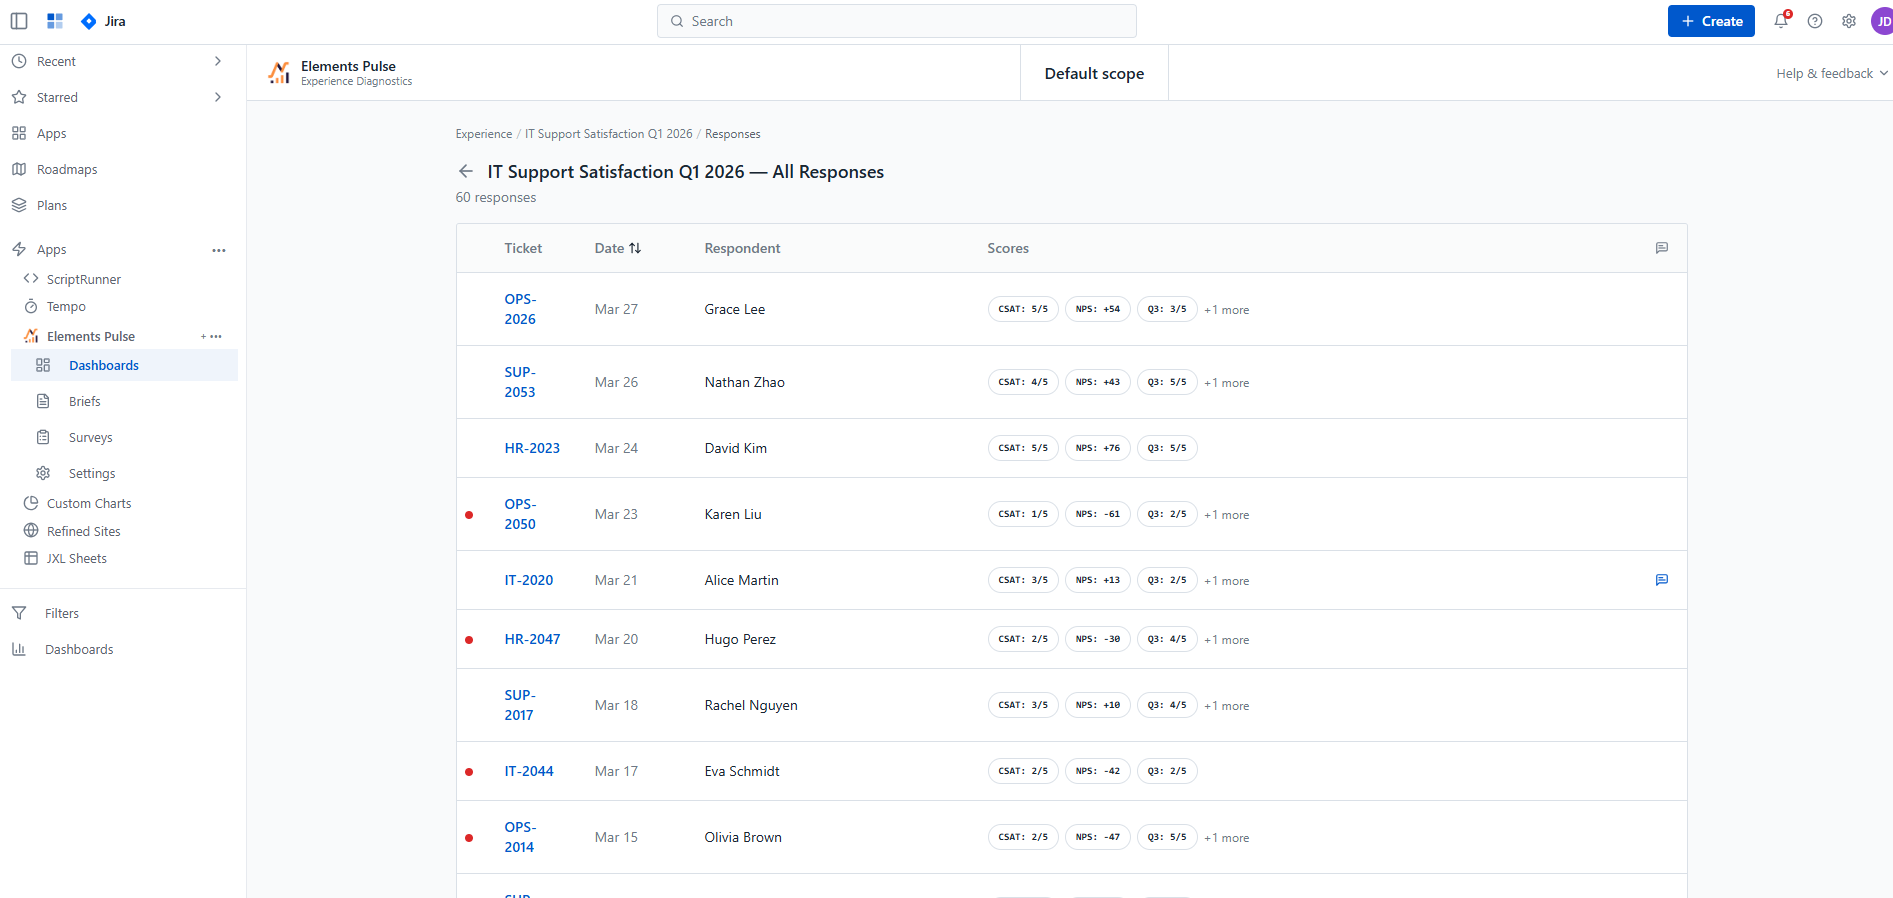
From the survey results page, clicking View all responses opens a consolidated response log for the entire survey. Each row represents a single submission and shows:
-
The linked ticket reference
-
The date of submission
-
The respondent name
-
A summary of scores across all questions in that submission, with a +N more indicator when additional questions are present
-
A chat icon where open-text feedback has been provided
Clicking any row opens the Response Details page for that individual submission.
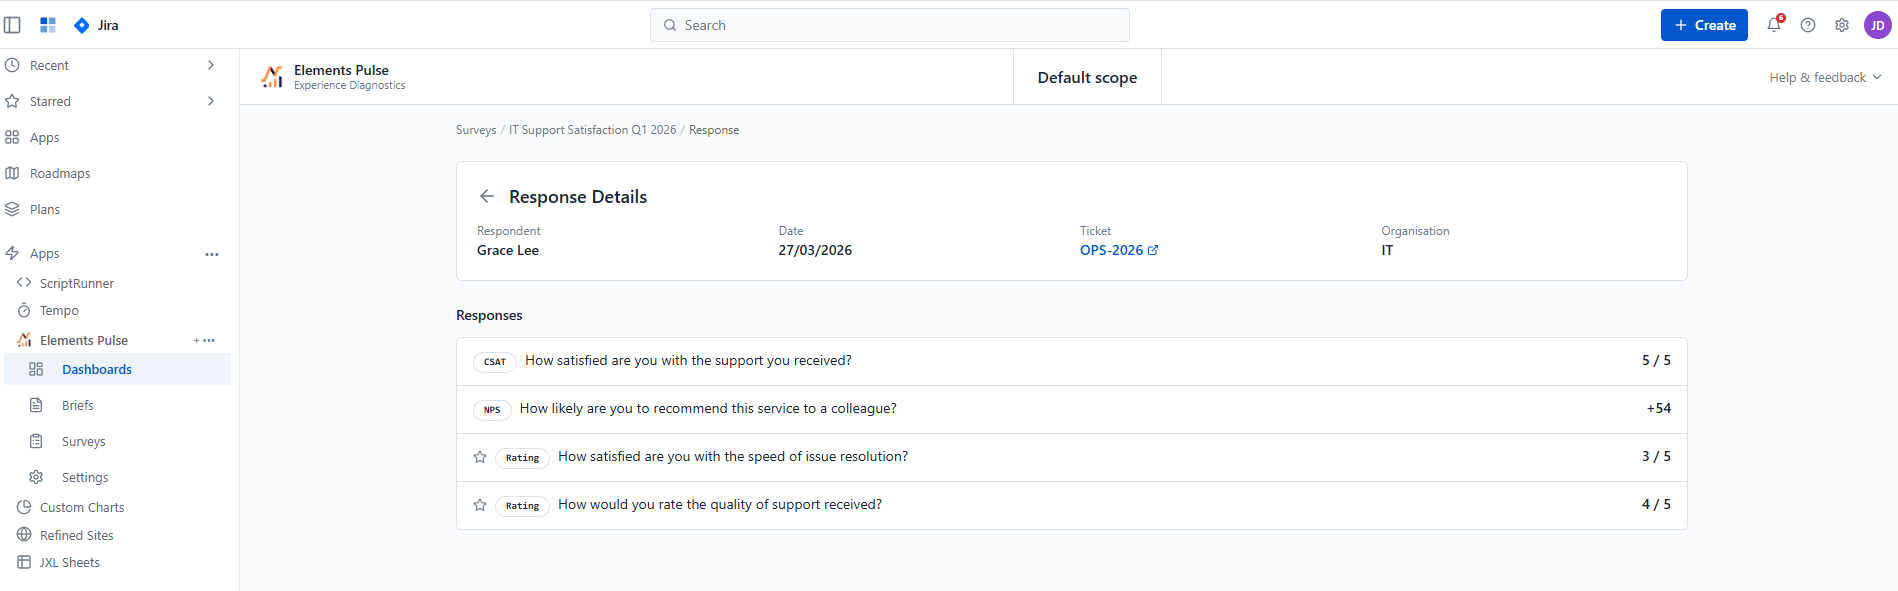
It displays:
-
A header with the respondent name, date of submission, linked ticket reference, and organisation
-
The full list of answers to every question in the survey, each labelled with its metric type badge (CSAT, NPS, Rating) and displaying the individual score given
This gives you the complete picture of a single employee's experience for a specific ticket, in full context.
Ticket references throughout are clickable and link directly to the originating JSM work item.